How does the new carbon pricing bill stack up?
By Jerry Hinkle, CCL Economics Policy Network
Upon the introduction of the Energy Innovation and Carbon Dividend Act, legislation authored by Representative Deutch and others (herein referred to simply as the Energy Innovation Act), Dr. Noah Kaufman of Columbia University’s Center for Global Energy Policy (CGEP) published an analysis comparing it to other carbon fee plans that have been proposed recently.
Specifically, the analysis compares Deutch’s new Energy Innovation Act to the American Opportunity Carbon Fee Act authored by Senator Whitehouse and others (Whitehouse), the Market Choice Act authored by Representative Curbelo (Curbelo), and the plan forwarded by the Climate Leadership Council (Baker). The analysis highlights the differences between Deutch’s Energy Innovation Act and others, and also uses analysis of these and other revenue-neutral carbon fee (RNCF) programs to indicate the likely economic and environmental impacts of the Energy Innovation Act.
Similarities
There are three key similarities between the plans:
1. They are “economy-wide” in the emissions covered, 90% of net greenhouse gas (GHG) emissions fall under the plan.
2. To minimize the number of entities taxed, the fee is collected upstream.
3. All plans have a border carbon adjustment (BCA) in order to avoid diminishing the competitiveness of emission-intensive, trade-exposed industries.
Differences
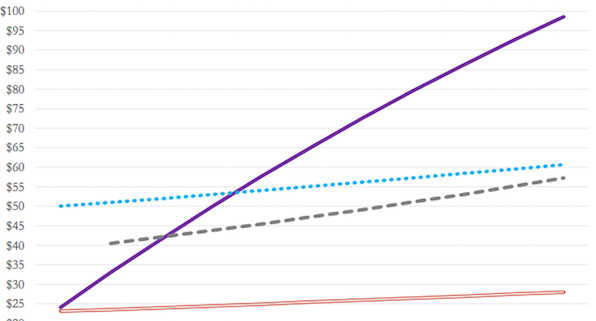
The first key difference pertains to the level of the carbon fee. As demonstrated in Figure One below from Columbia’s analysis, Deutch’s Energy Innovation Act starts the carbon fee lower but increases much more quickly (Footnote 1). As a result, the Energy Innovation Act’s fees are much higher by 2030, and the gap would continue widening. The bill also has a provision to raise the annual fee increase to $15 if emission reduction targets are not met. In all, the Energy Innovation Act reflects a much stronger escalating rate for a carbon fee and a much higher total price per ton of CO2e emitted by 2030 than recent proposals.
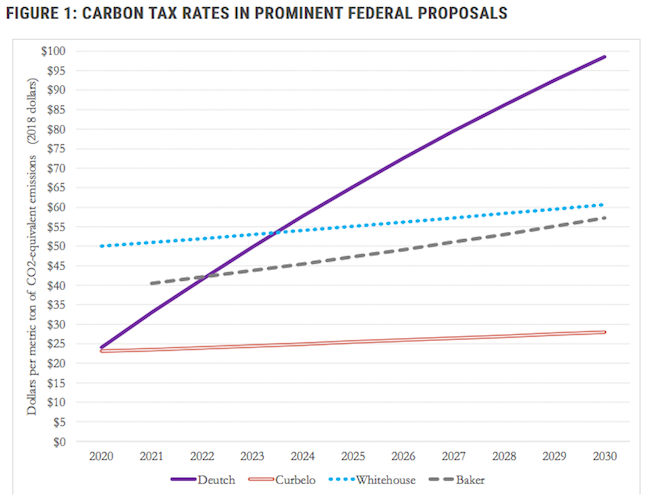
Notes: This assumes a 2% rate of inflation (2). Also, the Baker Proposal has not been formally proposed. A 2018 Climate Leadership Council report designated the carbon tax rates displayed above as its “mid-point” pathway.
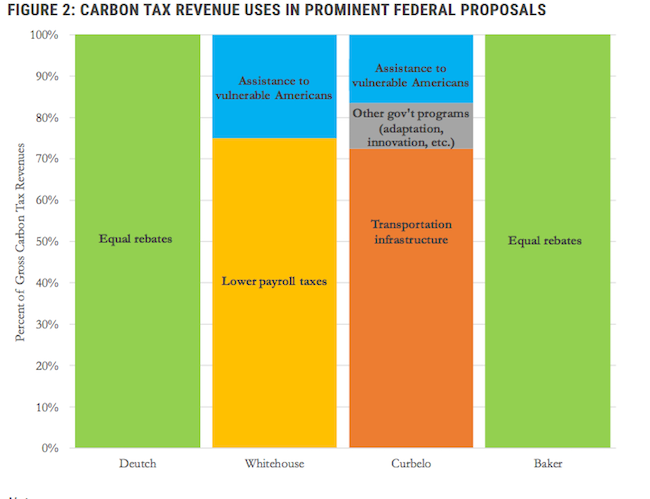
The second difference, as depicted in the Figure 2 below, pertains to what is done with the revenue. Though Deutch’s Energy Innovation Act and the Baker plan both return all funds to consumers, the Curbelo bill largely funds infrastructure spending (3) and the Whitehouse bill lowers the portion of the payroll tax paid by employees. Both of these plans also provide targeted funds to the poor to offset rising costs.
The third difference, as depicted in Table 1 below, pertains to regulatory changes. Of greatest significance, Deutch’s Energy Innovation Act puts a moratorium on the regulation of emissions that are subject to the carbon fee, but only as it pertains to their GHG effects. All other EPA authority over fossil fuel pollution and impacts that have components unrelated to GHG potential is retained. This includes retention of programs like vehicle fuel efficiency standards and methane abatement rules for oil and gas field operations. In addition, the Energy Innovation Act restores GHG regulatory authority if emissions targets have not been met after 10 years. While the Curbelo plan has a similar provision, Whitehouse retains all regulations, and Baker eliminates GHG regulations entirely. Only the Baker plan eliminates tort liability for emitters.
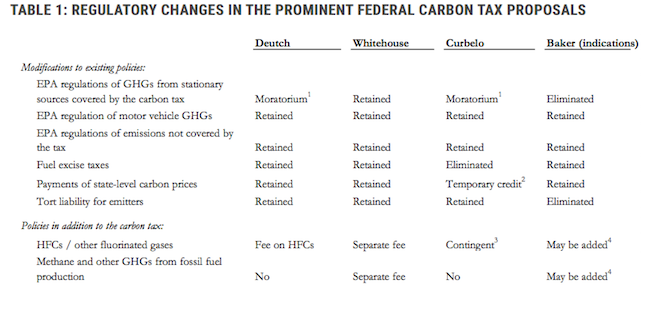
Table Notes:
1) Regulations are eliminated as long as emissions targets stipulated in the proposed legislation are achieved.
2) A temporary and declining credit against any carbon price paid at the state level, as in California or the RGGI states, that phases out after five years.
3) The carbon tax covers HFC emissions if the United States has not ratified the Kigali Amendment to the Montreal Protocol.
4) The Climate Leadership Council has indicated that it intends to propose measures that cover non-CO2 greenhouse gas emissions (Climate Leadership Council 2018).
Emissions and economic impacts
Because the Energy Innovation Act was just introduced, there has been insufficient time to conduct a detailed analysis of its impacts, but they can be inferred from analysis of similar RNCF plans evaluated in the recent past. Specifically, CGEP has conducted modeling of both the Curbelo and Whitehouse (4) plans. While the Baker plan has not been subject to similar economic analysis, because its carbon fee falls in between these two, the emissions impacts should fall there as well.
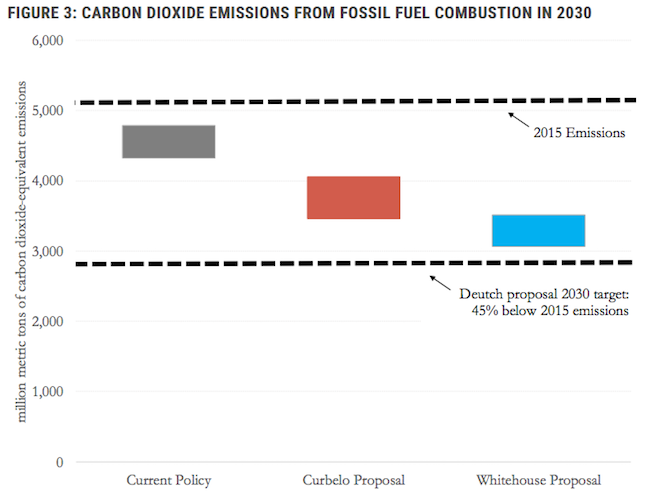
Figure 3 from the Columbia analysis, below indicates the estimated emissions reductions by 2030 for the non-policy scenario and the two bills. Note that reductions are depicted by a band, not a point, to reflect the uncertainty inherent in the estimate. By 2030, emissions decline slightly without any fee in the current policy scenario, and further reductions are determined by the strength of the carbon fee. Importantly, the Columbia analysis estimates that the Energy Innovation Act “likely” achieves the target of reducing emissions at least 45% below 2015 levels by 2030. Its rationale is that “projected emissions under the Whitehouse proposal bring emission levels 65 to 90 percent of the way to this 2030 target [of reducing emissions by 45%], and the Deutch Proposal’s carbon tax rates are over 60 percent higher (5) (in inflation adjusted terms) by 2030.”
Regarding macroeconomic impacts, the Columbia analysis notes:
- A carbon fee “leads to better economic outcomes” (i.e., is more efficient) than regulatory approaches.
- When revenue is distributed to households, as in Deutch and Baker plans, the policy is progressive, so that “low-and middle-income households would receive more in rebates than they pay in taxes…”.
- Returning the funds to households is not as stimulative as using the funds to reduce tax rates, such as the payroll tax cut in Whitehouse.
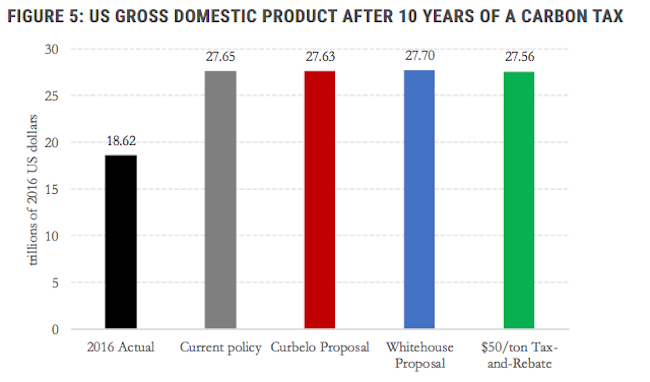
Finally, the estimated impacts to the United States Gross Domestic Product (GDP) are shown below in Figure 5 and are very minor. The Columbia analysis shows the Whitehouse bill, featuring labor tax cuts, adds slightly to GDP by 2030. The Curbelo bill, featuring investment in infrastructure, essentially breaks even. While Deutch’s Energy Innovation Act has not yet been evaluated, a RNCF plan that mirrors the Whitehouse fee schedule, but returns all funds to households, lowers the GDP growth rate from approximately 3.03% to 3.00% per year (roughly $6B of a $19,390B economy). This estimated impact is far less than 1) the annual health costs of GHG pollution, 2) the ever increasing costs of climate related damages, and 3) the cost of regulating carbon via regulation (6).
The Energy Innovation and Carbon Dividend Act will dramatically reduce America’s carbon pollution and start to bring climate change under control. CCL supporters nationwide are now mobilized in support of this policy. You can learn more and take action by clicking here.
Footnotes
- Curbelo starts at $24 and rises at 2% each year, and Whitehouse starts at $50 and rises at 2%. Baker starts at $40, and has not specified a rate of increase, though it is assumed to rise at 4% for this analysis.
- Deutch’s Energy Innovation Act is the only one where the price rise is not “inflation adjusted”: the fee rises $10 in constant dollars regardless of inflation. To compare it to the other plans, a level of inflation must be assumed. CGEP assumes 2%, which reflects the Federal Reserve’s inflation target.
- This bill also abolishes the federal gas tax.
- One of the scenarios evaluated in this analysis is a RNCF that begins at $50 and rises 2% a year, just as the Whitehouse bill does.
- In 2030, the Deutch carbon fee will be $125, or over 60% higher than the estimated Whitehouse price of approximately $77 (this assumes 2% inflation). CGEP’s point is that if the Whitehouse carbon fee yields reductions that are 65% to 90% of the emission reduction goal, a price 60% higher should cause reductions that are at least 100% of the goal.
- The EPA has estimated the economic cost of regulating carbon via the Clean Power Plan at between $7B and $14B a year.
Jerry Hinkle is an economist who holds master’s degrees in Economics and Climate Policy.
The Economics Policy Network is a team of CCL leaders and supporters with a diverse background in the field of economics. These network contributors write regular guest posts, offering thorough insight into topics that fall within their expertise. Their resources are available in the form of white papers on CCL Community.


