
Rep. Carlos Curbelo introduced the Market Choice Act in July 2018.
The economic and emissions impacts of the Market Choice Act
By Jerry Hinkle, CCL Economics Policy Network
On July 23, Rep. Carlos Curbelo (R-FL), the co-chair of the Climate Solutions Caucus, introduced the Market Choice Act, HR 6463. The purpose of this post is to explore estimates of the economic and emissions impact of the bill. We discuss the general provisions of the bill, the economic and energy models used to evaluate it, and the resulting estimated impacts. Note that the analysis discussed here will be discussed further by the principal author of the studies, Dr. Noah Kaufman, in the Citizens’ Climate University session presented on Thursday, September 13.
The bill
HR 6463 would place a $24/ton tax on CO2 emissions that rises 2% plus the rate of inflation each year. If specified emission reduction thresholds are not met, the tax would rise an additional $2/ton every two years until they are met. The 18 cent/gal. federal gas tax would be eliminated. The bill contains a refund for carbon capture and storage (CCS) as well as well as a border carbon adjustment (BCA). The net revenues would be spent as follows: 25% are returned to the U.S. Treasury, and the remaining 75% go to a trust fund. Of the amount going to the trust fund, 70% goes to the Highway Trust Fund (adding $285B), 10% to low income recipients, and 5% for coastal flooding mitigation. Additional funds would go for emission mitigation R&D and to assist displaced workers. Finally, a “performance-based” moratorium would be placed on the regulation of greenhouse gases under the Clean Air Act as long as the emission reduction thresholds are met, though the moratorium expires in 2033.
The models
Just prior to issuing its analysis of the Curbelo bill (Bill), Columbia University’s Global Center for Global Energy Policy (CGEP) coordinated work from a set of modeling groups to issue a much more extensive analysis of the emissions and economic impacts of various revenue neutral carbon tax (RNCT) policies. This study is important as it utilized the same set of models as the Bill analysis, so it provides insight into the methods used to evaluate the Bill. The study is embodied in four papers: 1) a summary report from CGEP, 2) an analysis of energy market and emissions impacts from the Rhodium Group, 3) an analysis of income distribution implications by Brookings, and 4) an analysis of economic impacts by the Baker Institute.
A point made by the author, which was also made in the February 2018 EMF 32 study of RNCT policies described in an earlier blog, should be highlighted. These models have limitations and cannot readily reflect some of the economic benefits stemming from a carbon tax or the cost of not acting on climate. As a result, they believe that “on balance, omitted factors suggest that economic outcomes are likely to be better than suggested by current economic models” (underline added). Though the model results offer valuable insights, their limitations must be understood as well.
The Curbelo bill
U.S. emission reductions are evaluated relative to 2005 levels to assess progress with commitments to the Paris Accord. In 2016, emissions were already 11% below 2005 levels (see chart below). Without the carbon tax (the “current policy” scenario), Rhodium estimates that emissions would decline to between 18%-22% (Footnote 1) below these levels by 2025 and to 19%-26% below by 2030. With Curbelo’s Market Choice policy (the “carbon tax” scenario), emission levels would fall further to 27%-32% below by 2025 and by 30%-40% below by 2030. These reductions would meet or exceed the U.S. commitments to the Paris Accord of 26%-28% below 2005 levels by 2025. The author also makes clear that this estimate includes only U.S. reductions, and that it is likely the passage of a clear U.S. policy to reduce emissions would stimulate further reductions from other major emitters, so that global emission reductions from the policy would be even greater.
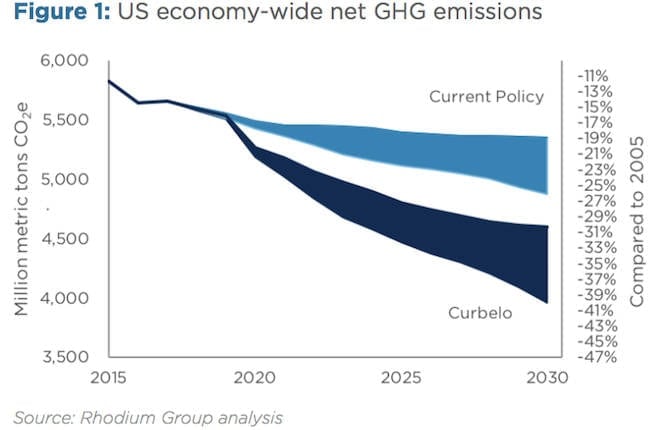
More than 2/3 of the reductions come from the power sector. Coal production is reduced 50% by 2030 relative to current policy. Oil production is essentially unchanged, and natural gas production initially rises then falls slightly, relative to current policy.
The economic impacts of the policy are minimal, though slightly negative. The Baker Institute model estimates that GDP falls initially by 0.2% of GDP, but then improves slightly relative to the current policy so that by year 10, GDP is only 0.1% lower. To put this decline in context, if average annual GDP growth were 2.01% in the current scenario and 2.00% in the carbon tax scenario, after 10 years, GDP would be about 0.1% higher (i.e., 10 years times .01% per year) in the current scenario. So the impact on GDP is almost negligible. Likewise, total hours worked are 0.02% lower after 10 years. This could be likened to an unemployment rate of 4.00% with the current policy vs. 4.02% with the carbon tax policy.
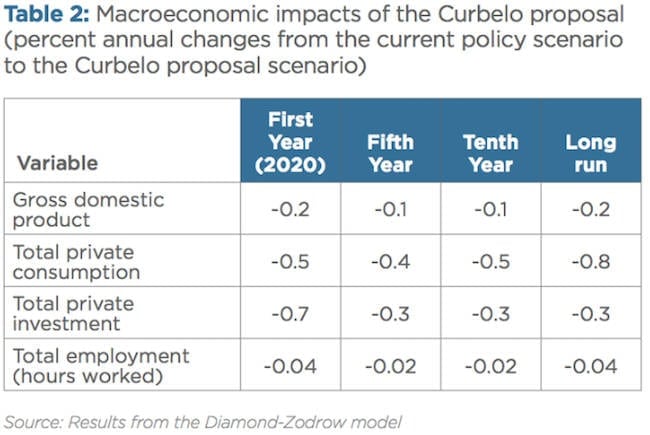
Do the slightly negative economic results indicate the policy is bad for the economy? Absolutely not, for the following reasons. First, the author makes clear economic results are likely stronger than estimated, for a variety of reasons (2). Second, climate benefits have been estimated at twice the economic costs (3). Third, health benefits from the reduced emissions are roughly three times economic costs. And fourth, EPA estimates suggest the cost savings to the economy from the reduced regulations is also multiples of the cost (4). These are some of the key reasons economists argue strongly that charging for carbon pollution is the right thing for the economy.
Footnotes
- CGEP presents a range to reflect the uncertainty in reductions stemming from the unknown pace of technological improvement and implementation. Prior studies have discussed this uncertainty, but have not attempted to quantify it. The authors make clear overall uncertainty is greater than that quantified (the ranges should be even broader).
- As one key example, discussed in this CCL blog post, a carbon price is likely to generate significant R&D and investment in new low carbon technologies.
- For a comparison of economic costs and climate and non-climate benefits, see Confronting the Climate Challenge by L. Goulder and M. Hafstead, page 117.
- EPA estimates of the benefit of avoiding the cost of GHG regulation will be the topic of an upcoming blog post.
Jerry Hinkle is an economist who holds master’s degrees in Economics and Climate Policy.
The Economics Policy Network is a team of CCL leaders and supporters with a diverse background in the field of economics. These network contributors write regular guest posts, offering thorough insight into topics that fall within their expertise. Their resources are available in the form of white papers on CCL Community.


