Citizens’ Climate Lobby has advocated for Carbon Fee and Dividend for nearly a decade. In 2019, members of the House introduced the bipartisan Energy Innovation and Carbon Dividend Act, which embodies the fee-and-dividend approach we support. We are now advocating for this specific bill.
The Environmental, Economic and Health Impact of Carbon Fee and Dividend
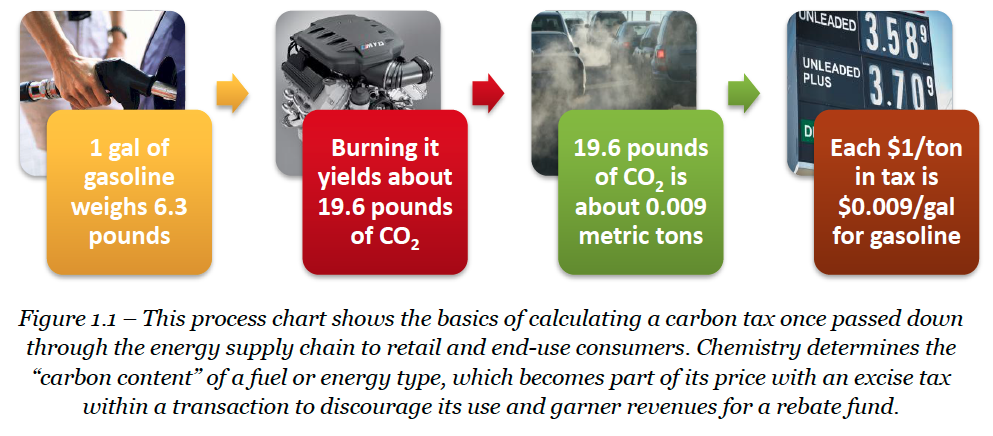
In 2013, CCE commissioned Regional Economic Models, Inc. (REMI) to study the effect of a revenue-neutral carbon price on the American economy. Chosen for its track record of providing analysis to both governmental bodies and the fossil fuel corporations, REMI’s analysis concluded that such a system would have strong positive economic effects on the nation’s health and prosperity alike.
REMI’s analysis concluded that, during the first 20 years alone, a CF&D policy would lead to:
- A 50% reduction of carbon emissions below 1990 levels
- The addition of 2.8 million jobs above baseline, driven by the steady economic stimulus of the energy dividend
- The avoidance of 230,000 premature deaths due to reduction in air pollutants that often accompany carbon emissions
These remarkably positive results were due to REMI’s detailed modeling, which included an aggressive rate of increase, a 100% dividend minus administrative costs, and consideration of the economic effects of associated health benefits. REMI’s findings at a given level of a carbon fee are consistent with other studies; for example, a May 2013 study by the Congressional Budget Office found that a $20 per ton carbon fee would result in an 8% reduction in national emissions. The results of the REMI report are thus supported by complementary studies as well as by the organization’s long track record of analysis for both governmental bodies and the fossil-fuel industry.
A common reason for opposing climate action is the belief that any reduction in carbon emissions must be accompanied by reductions in economic activity. The REMI report has proven to be one of CCE’s most powerful educational tools, allowing citizens to directly address economic concerns—and to demonstrate the substantial economic upsides to a CF&D system.
REMI Report Resources
National Summary Downloads: Full REMI Study (150-page PDF) and National Summary (4-page PDF)

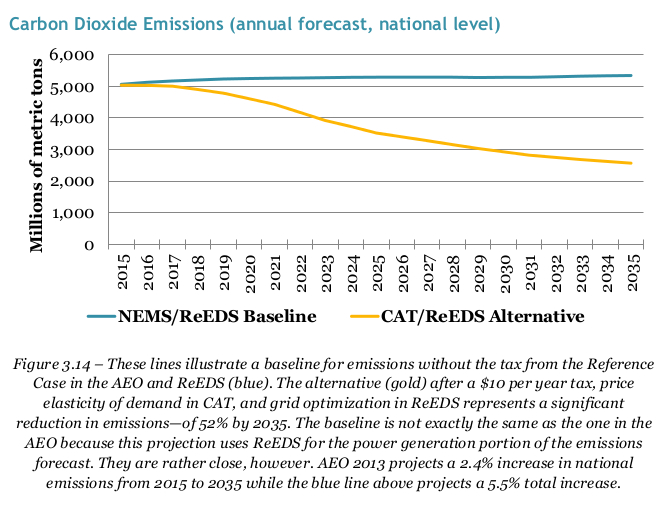
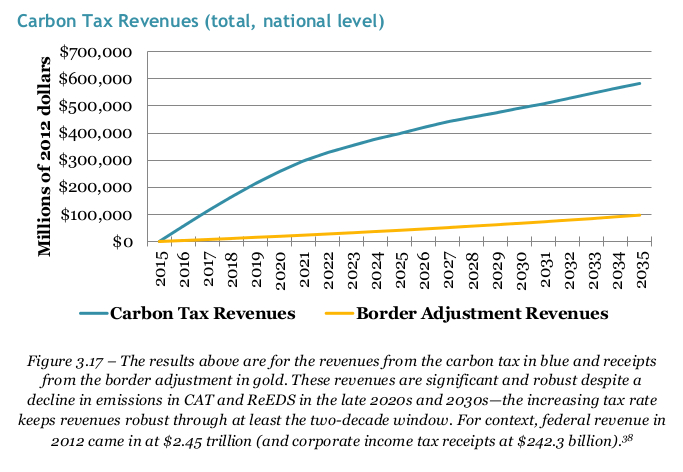
Figure 1: U.S. CO2 emissions under F&D (yellow) and without a carbon tax (blue). F&D reduces US emissions to 69% of 1990 levels by 2025, and to 50% by 2035.
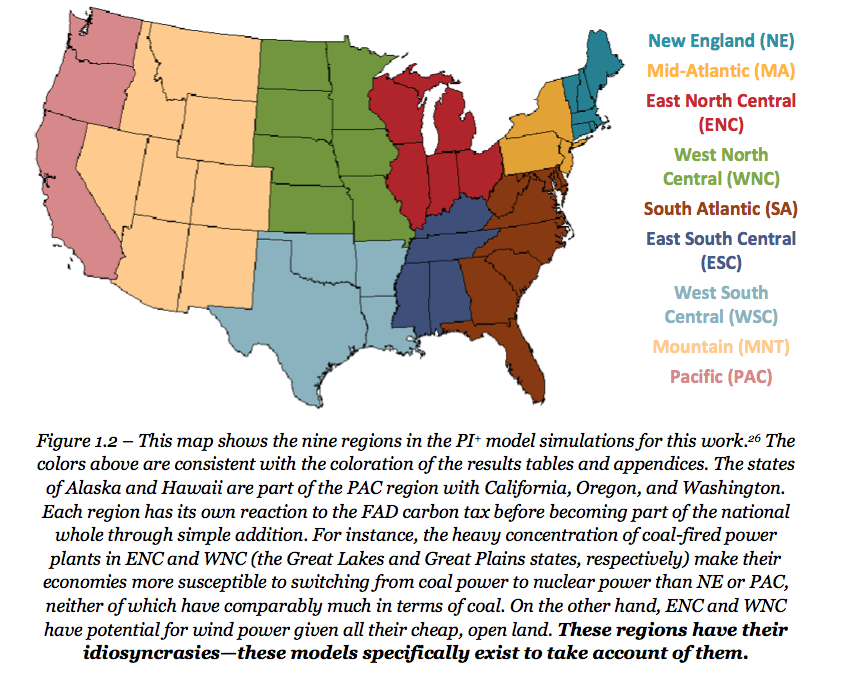
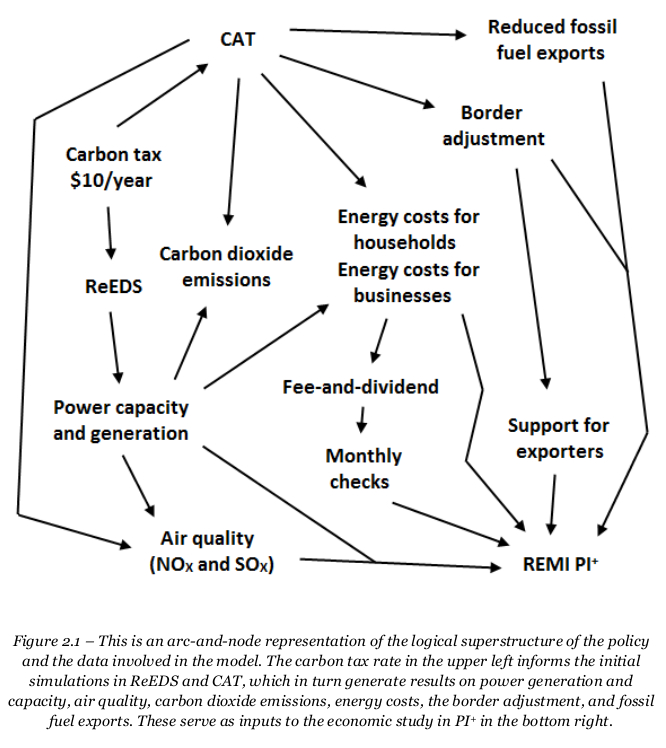
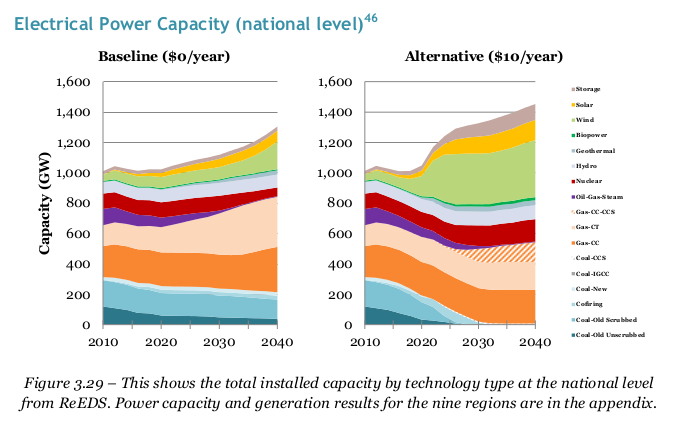
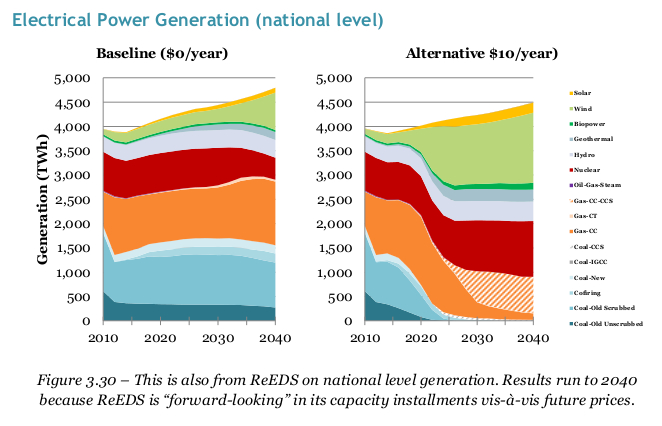
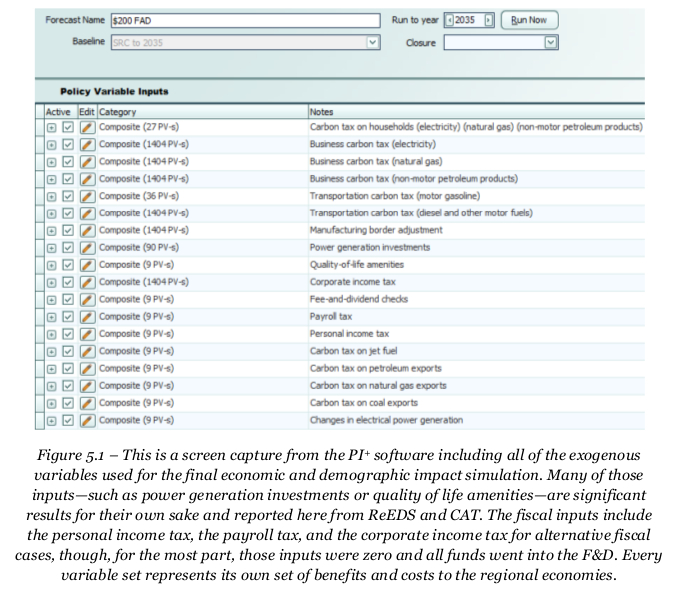
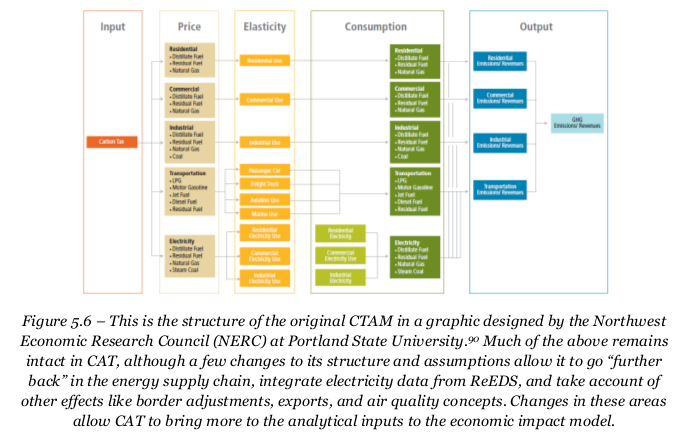
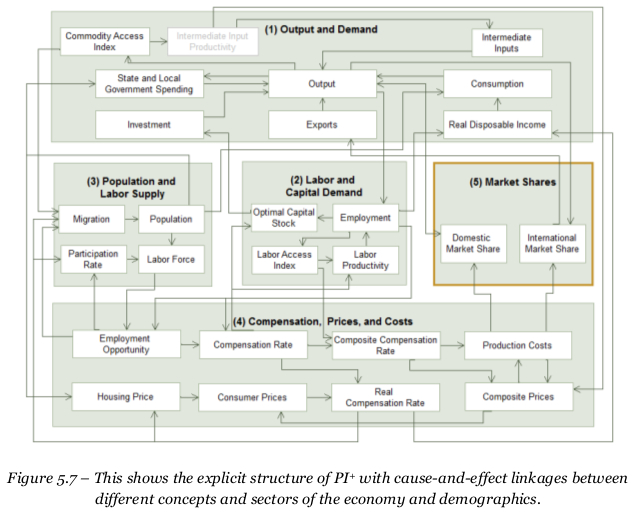
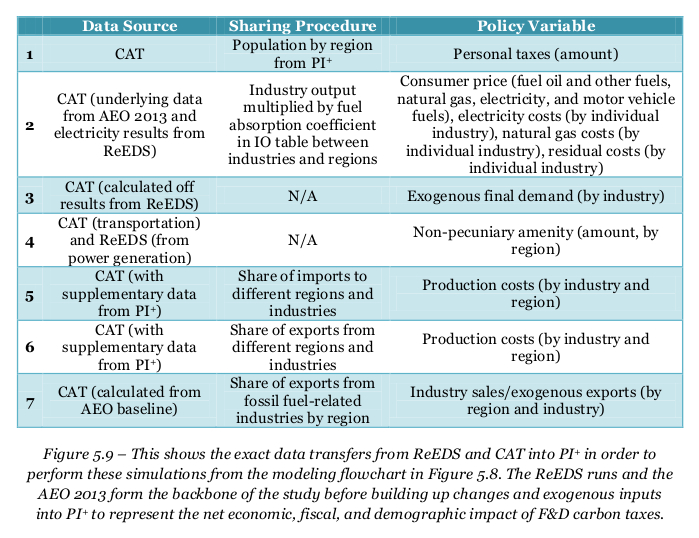
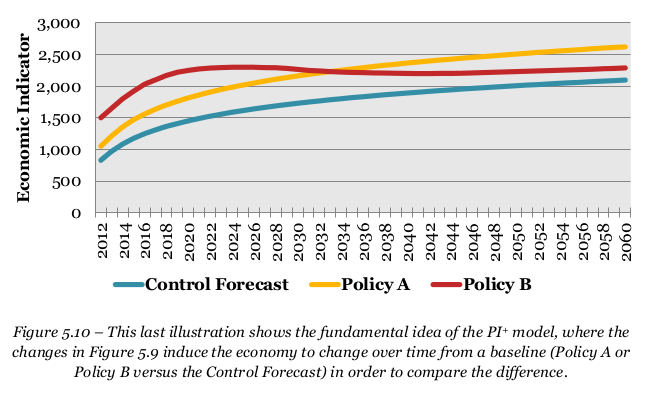
Citizens’ Climate Education Corporation (CCEC) and Citizens’ Climate Lobby (CCL) contracted a third party, Regional Economic Modeling, Inc. (REMI) to do a nation-wide macroeconomic study on the impact of its Fee and Dividend (F&D) policy. The policy modeled is not a perfect representation of F&D (most obviously, F&D begins at $15 per ton whereas the study began at $10 per ton), but it is quite close, and accounts for the impact F&D’s border tariff adjustment would have on the US economy. REMI used three models to do the study: (1) The Regional Energy Deployment System (ReEDS) built by the National Renewable Energy Laboratory and run by Synapse Energy Economics; (2) the Carbon Analysis Tool (CAT); an enhancement of the open-source CTAM model and populated by data from the US Energy Information Administration (EIA); and (3) REMI PI+, a proprietary dynamic model of subnational units of the United States’ economy whose methodology and equations are peer-reviewed and available to the public. Output included impacts on 160 industries, nationally and regionally for the 9 “U.S. Census” regions commonly grouped together in a number of federal data sources and in the energy market forecasts from the EIA.
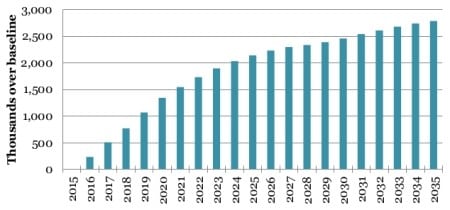
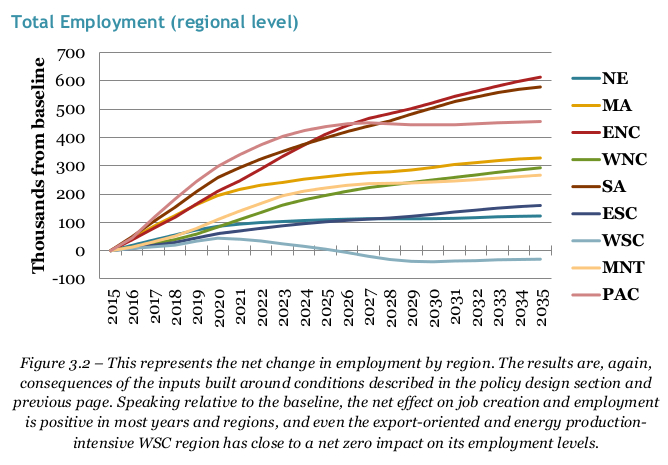
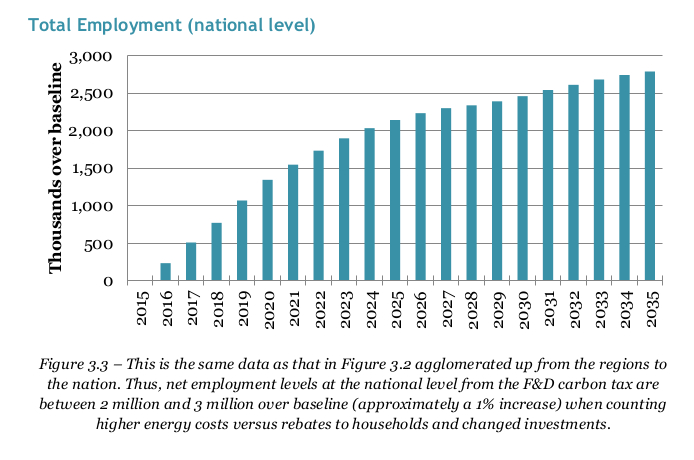
Figure 2: Thousands of jobs created by F&D relative to the case without a carbon tax. Over a million jobs created within 4 years, over 2 million within 9 years.
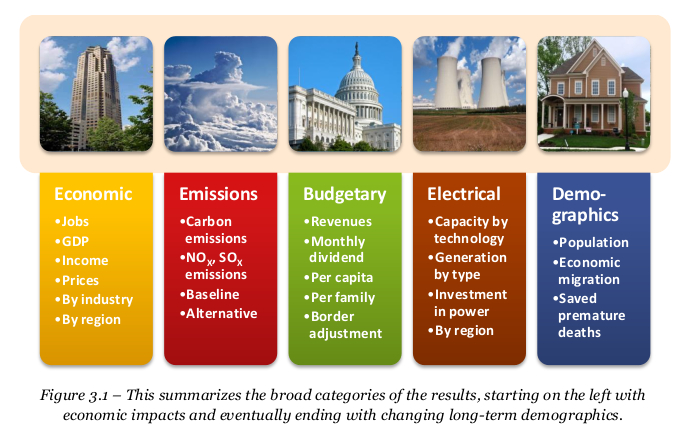
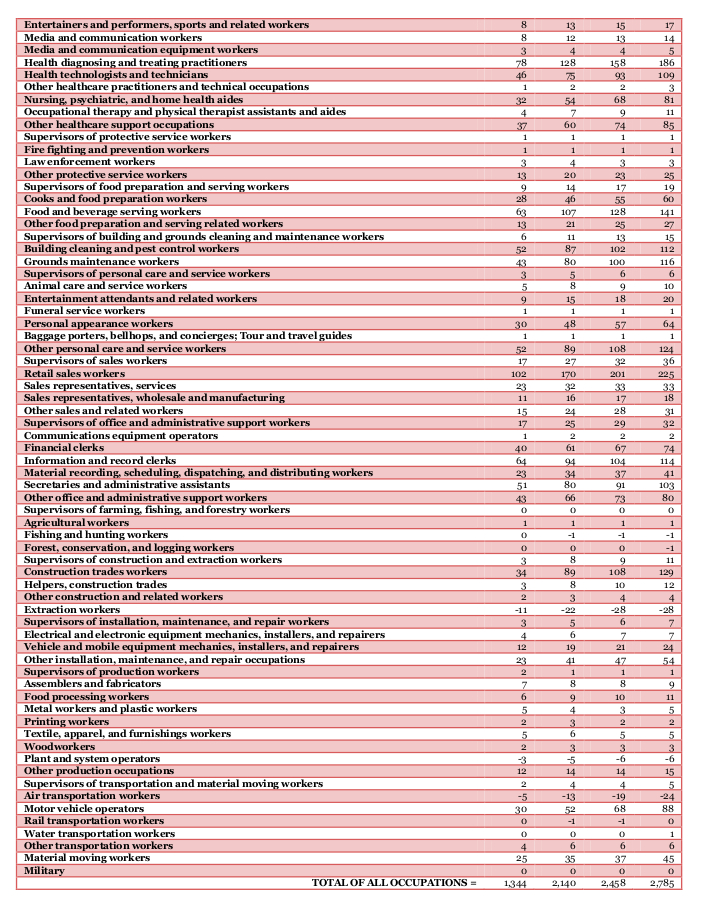
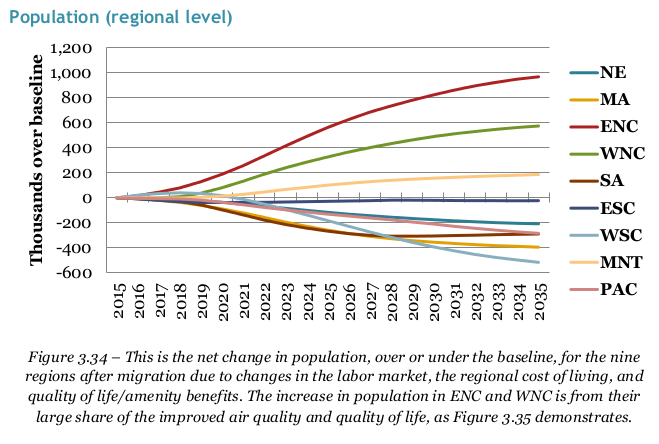
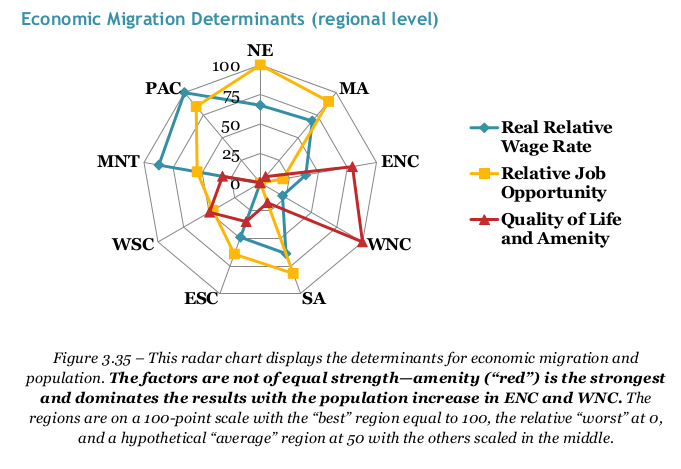
Model results were able to estimate the effects of the policy on GDP, personal income, employment, prices, carbon dioxide emissions, mortality due to NOx and SOx emissions, revenues, monthly dividend amount, energy generation capacity by technology, energy generation by type, investment in power, population, and economic migration on both a regional and national level. Income and employment figures for each of 160 industry categories considered are included. These 160 industries encompass the entire economy.
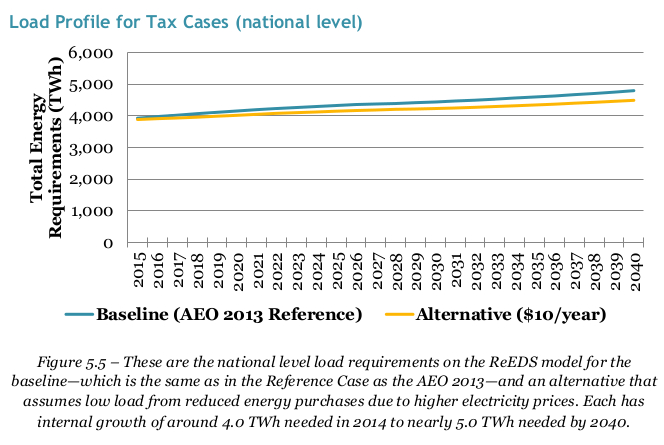
The results are all relative to a baseline case where there is no carbon tax (modeled by using the exact same set-up, with a $0/ton value for the carbon tax). In other words, all three models were run two times. Both times, the set-up was identical except for one thing: the price of carbon was either $0 from 2016-2035 (the baseline), or was $10 per ton in 2016 and increased by $10 every year after that (F&D).
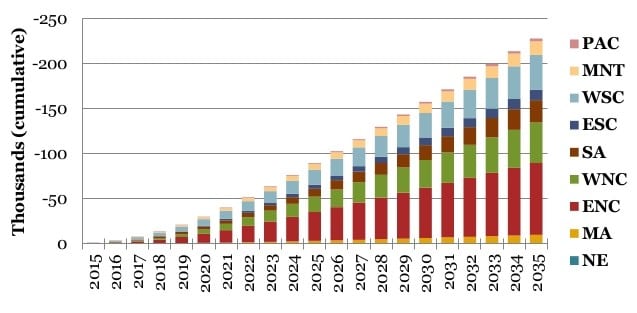
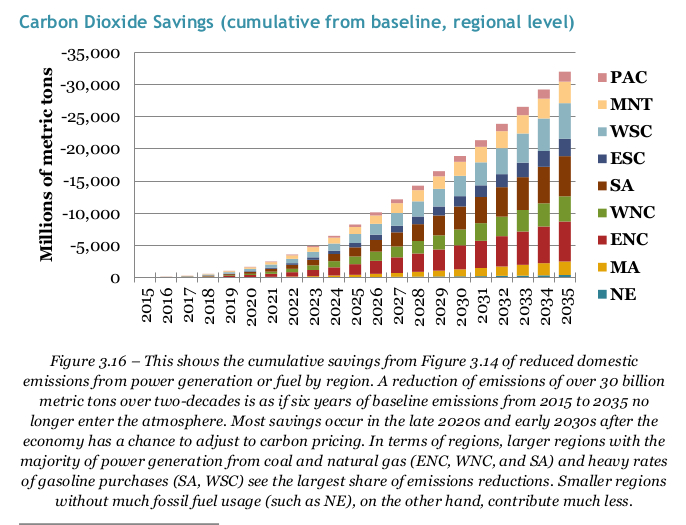
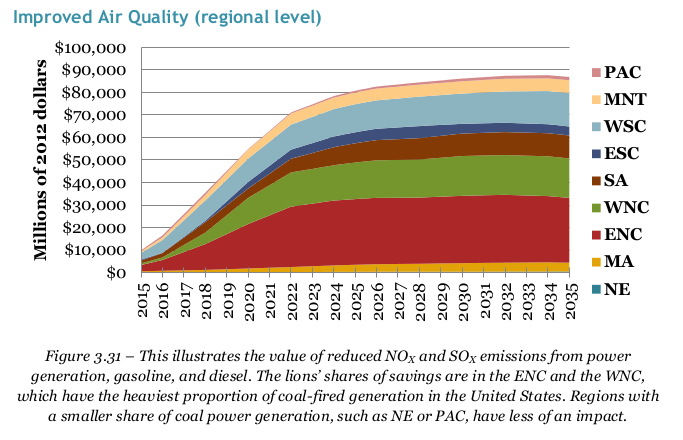
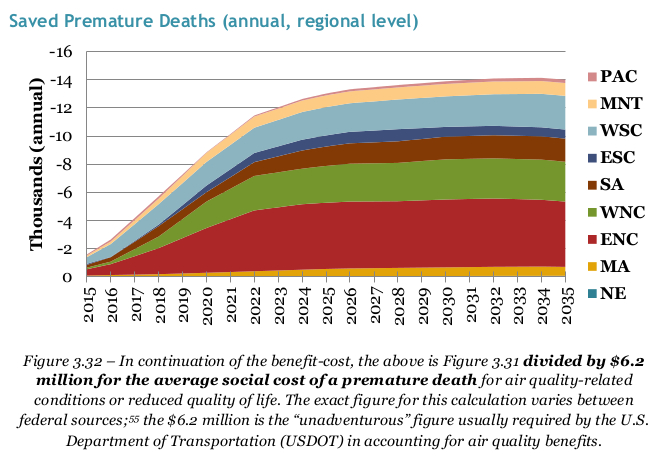
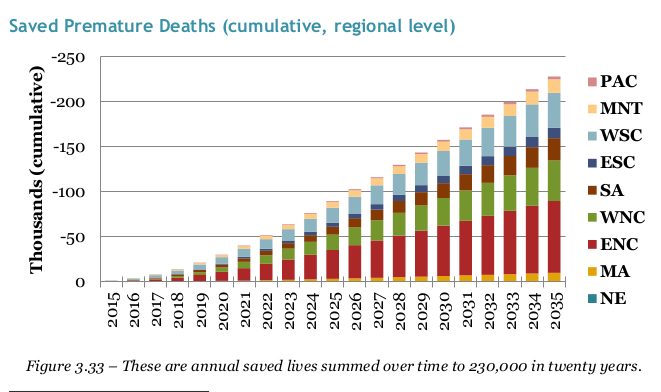
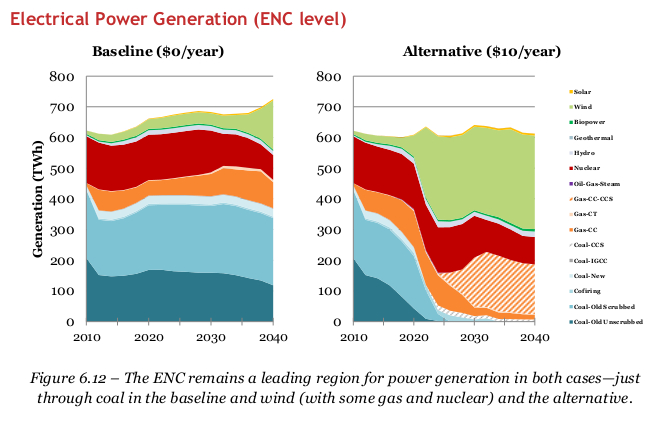
Figure 3: Cumulative lives saved from avoided emissions by region under F&D. Region ENC, including Ohio, Indiana, Michigan, Illinois, and Wisconsin, has the most lives saved. 227,000 American lives would be saved in 20 years under F&D.
REMI Study Highlights
-
- CO2 emissions decline 33% after only 10 years, and 52% after 20 years relative to the baseline, $0/ton of CO2 case (Figure 1).
- National employment increases by 2.1 million jobs after 10 years, and 2.8 million after 20 years. This is more than a 1% increase in total US employment we don’t get without a carbon tax (Figure 2)!
- 13,000 lives are saved annually after 10 years, with a cumulative 227,000 American lives saved over 20 years (Figure 3).
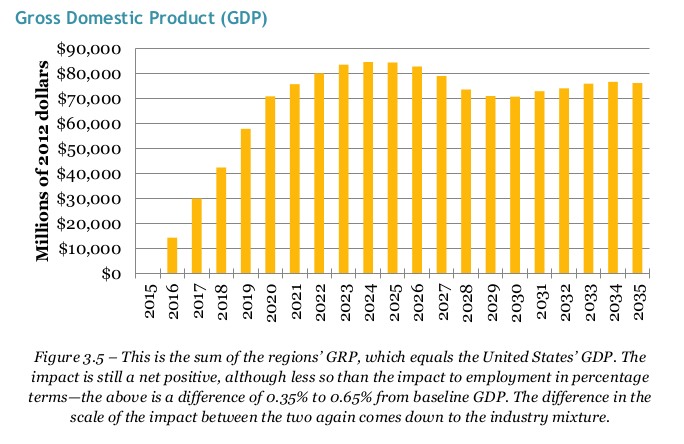
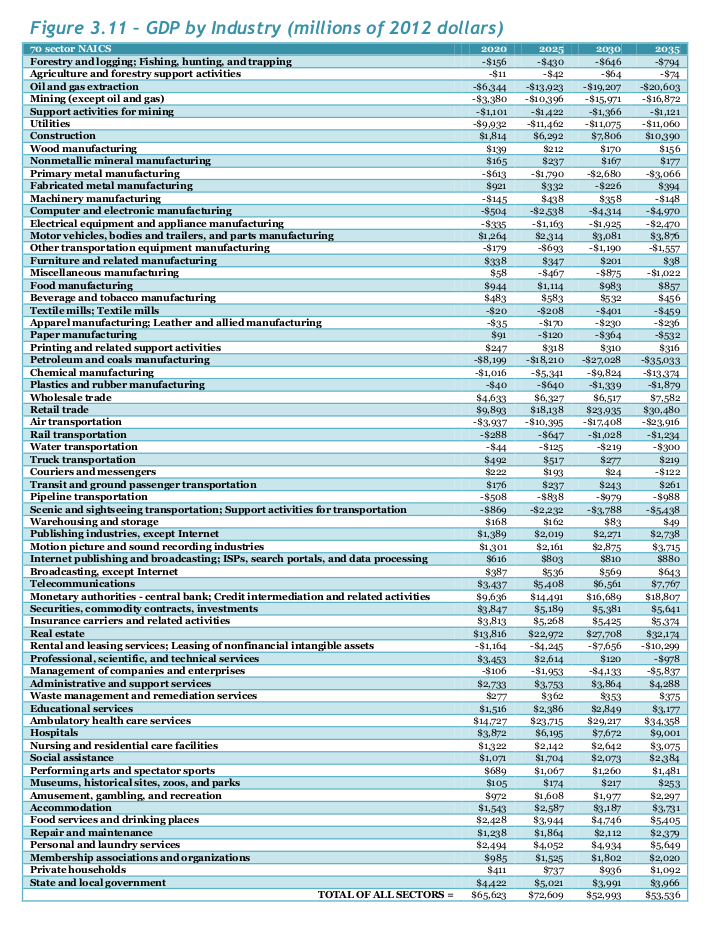
- $70-$85 billion increase in GDP from 2020 on, with a cumulative increase in national GDP due to F&D of $1.375 trillion (Figure 4).
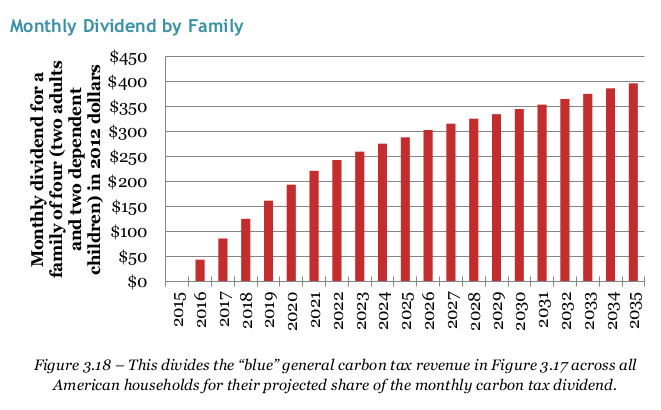
- Size of monthly dividend for a family of 4 with two adults in 2025 = $288, and in 2035 = $396. Annually, this is $3,456 per family of 4 in 2025 ($1152 per capita–children get 1⁄2 dividend) (Figure 5).
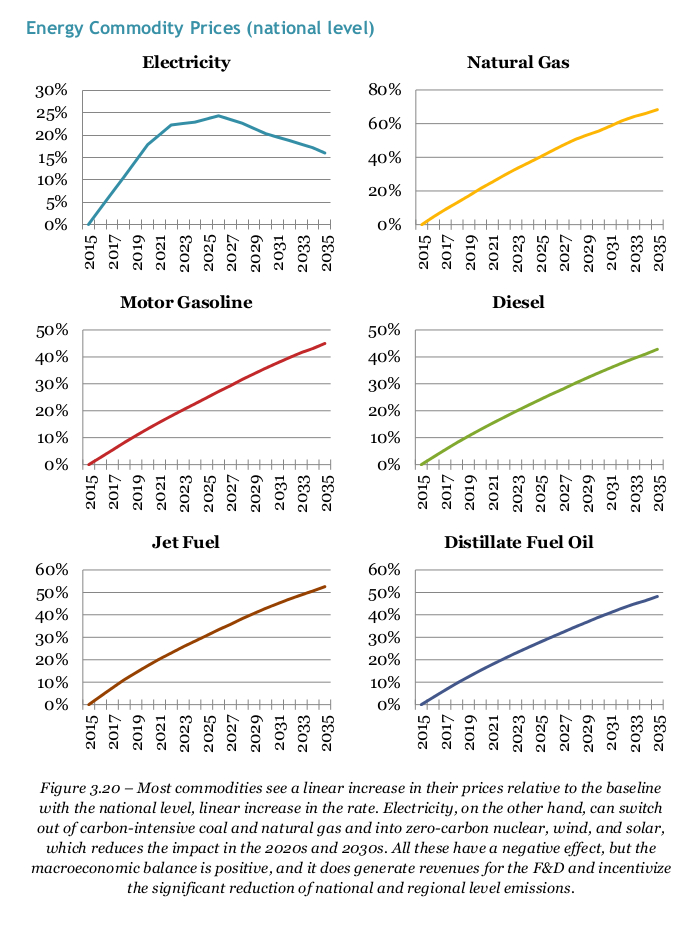
- Electricity prices peak in 2026, then start to decrease.
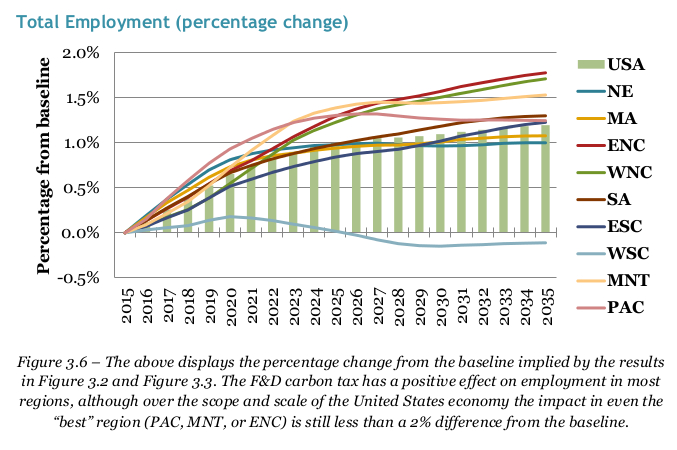
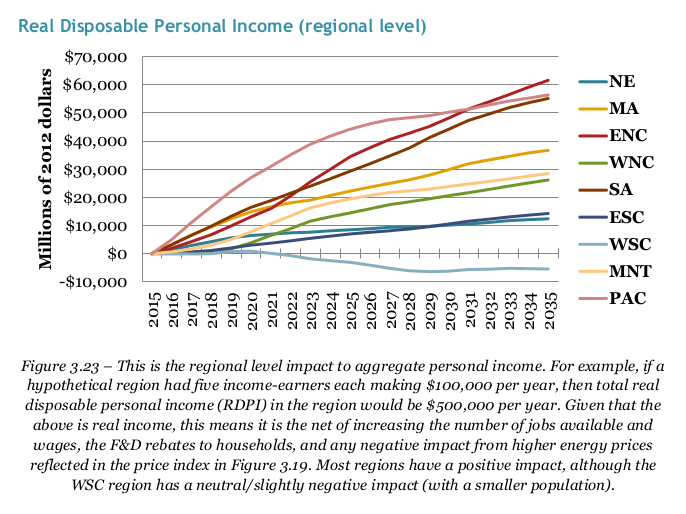
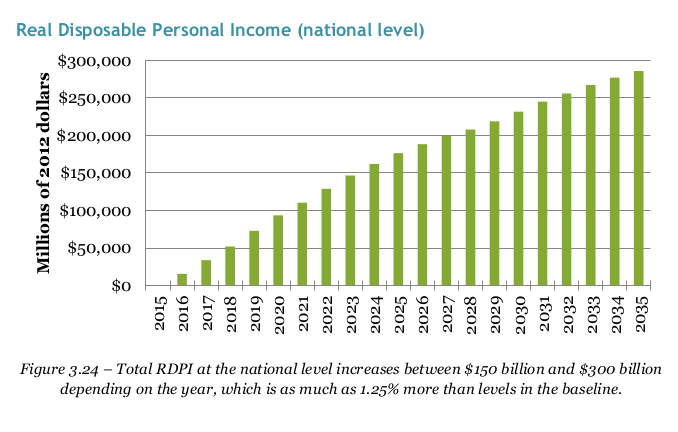
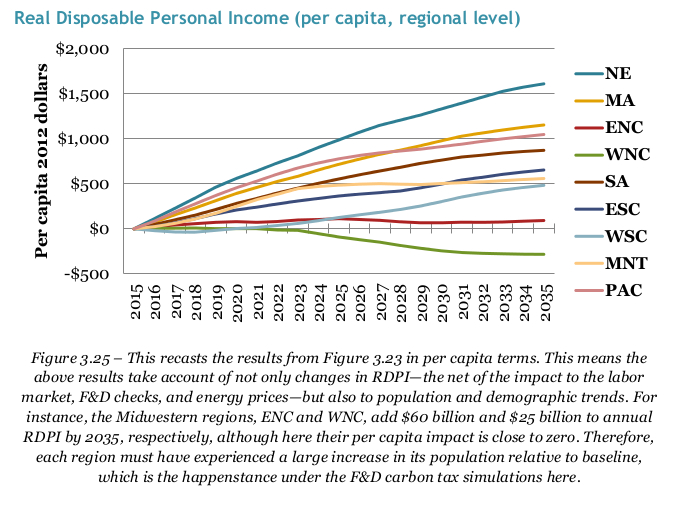
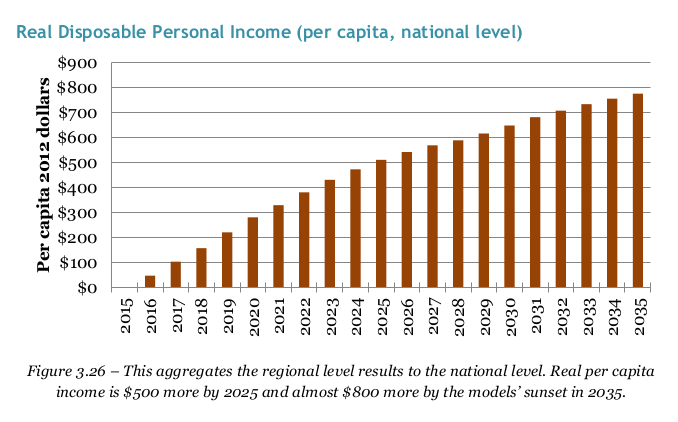
- Real incomes increase by more than $500 per person in 2025. This increase accounts for cost of living increases (Figure 6).
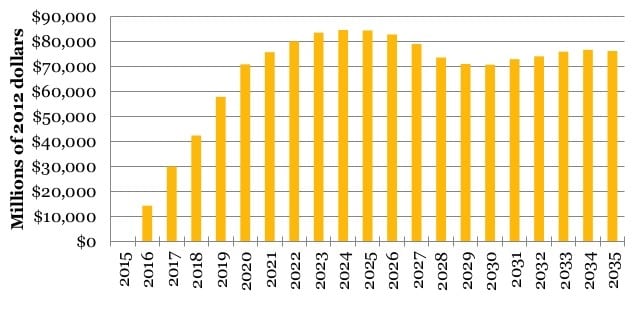
Figure 4: Annual additional GDP due to Fee and Dividend relative to no carbon tax. The numbers are positive due to a net increase in jobs and more consumer spending from the dividend. Over the 20 years of the study, GDP is $1.375 trillion higher than without F&D.
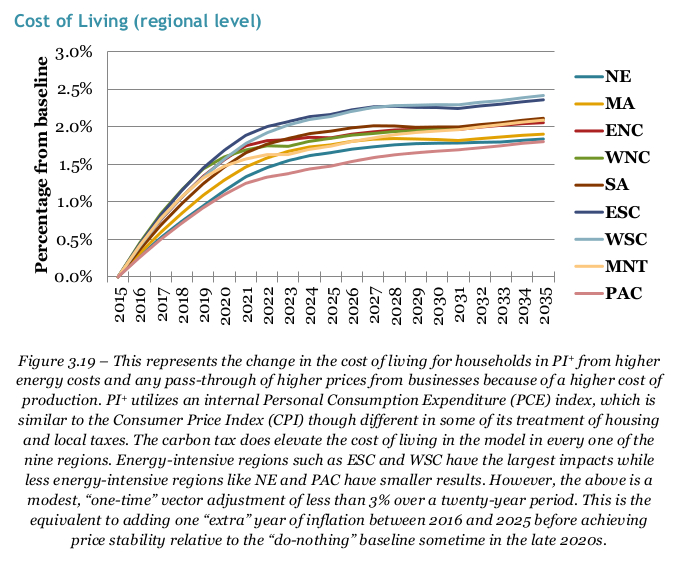
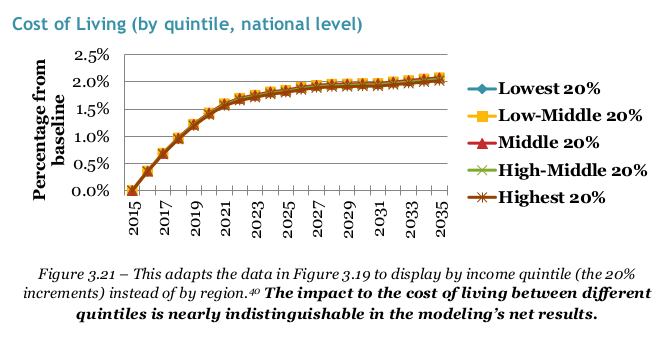
- Maximum cost-of-living increase by 2035 is 1.7-2.5%, depending on region (Figure 7).
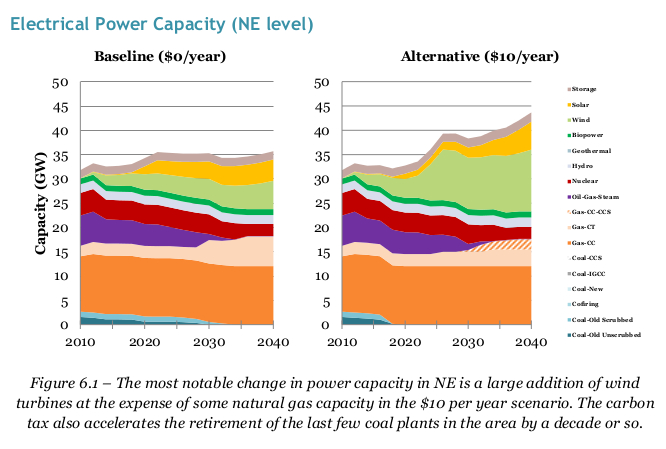
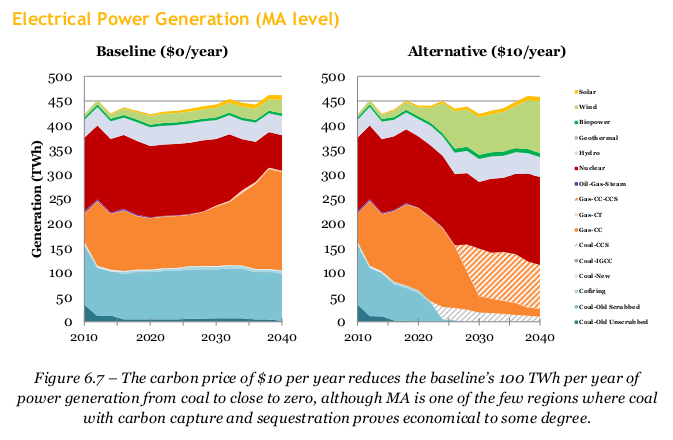
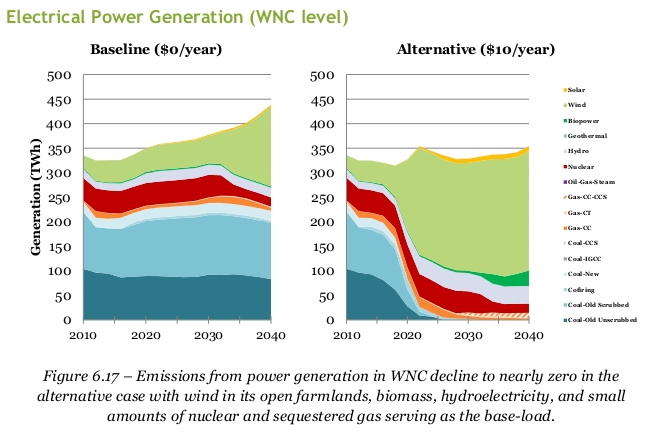
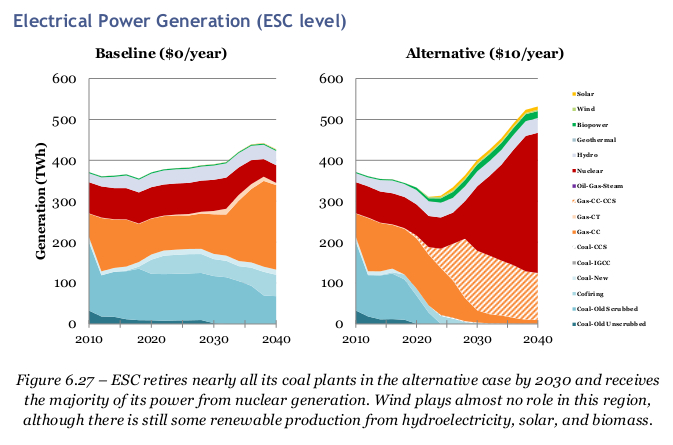
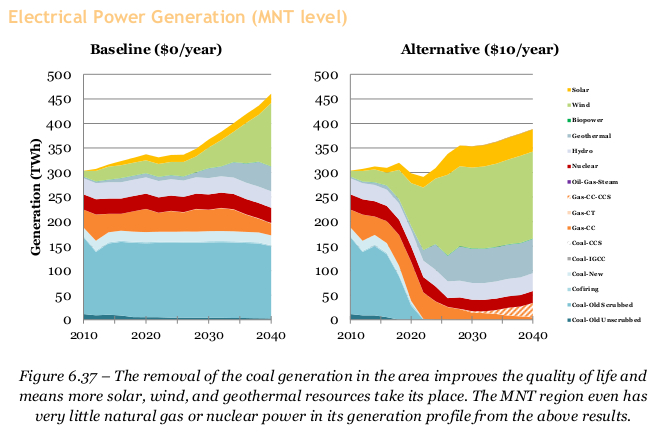
- Electricity generation from coal is phased-out by 2025.
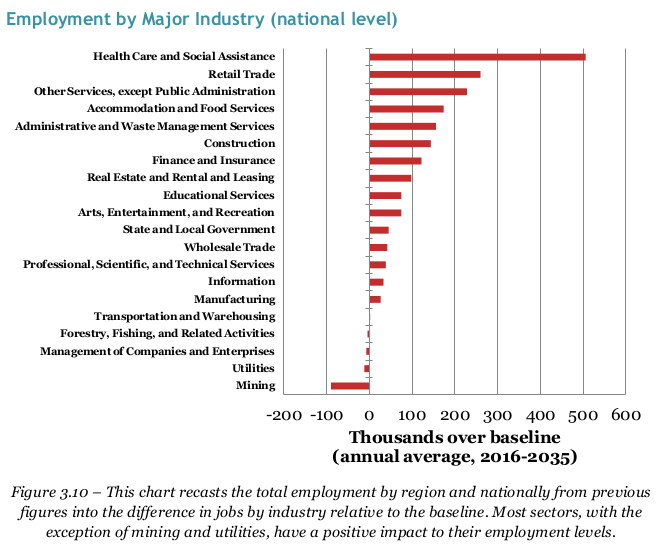
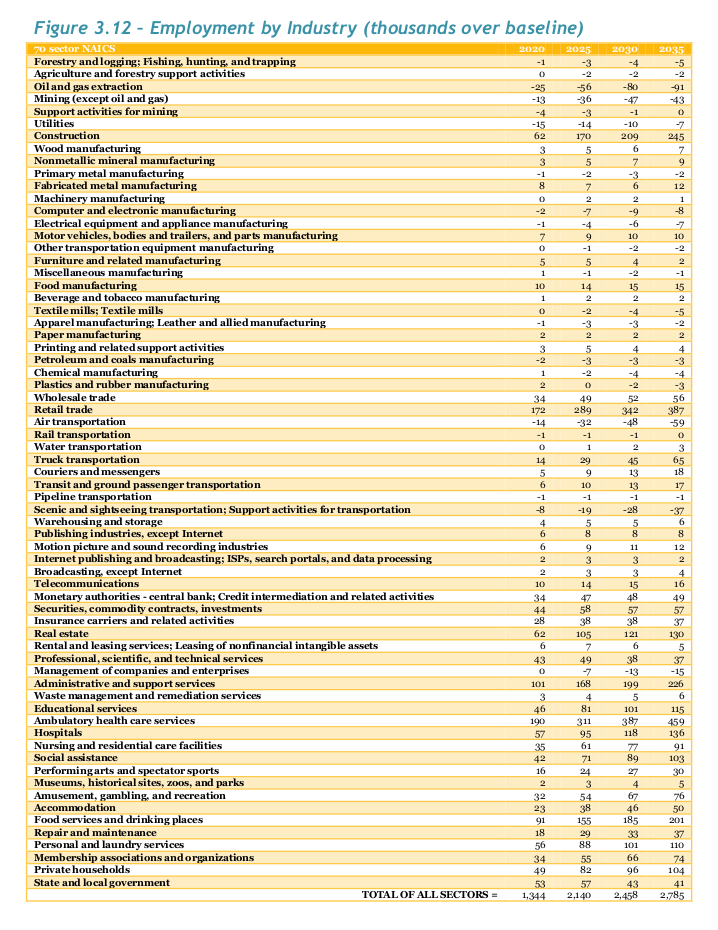
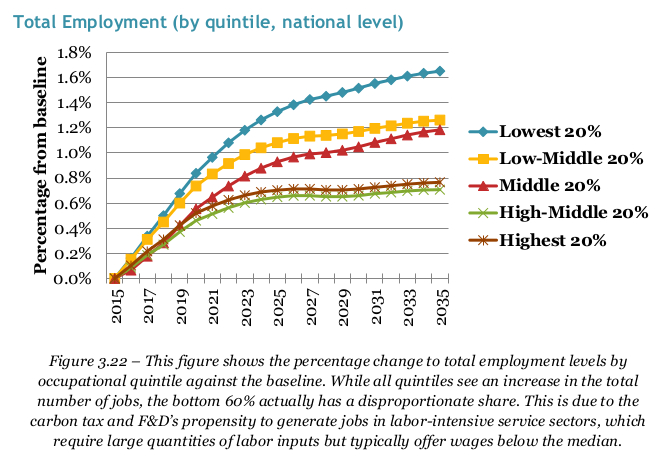
- Biggest employment gains in healthcare, retail, and other services (excluding public administration). This is because people have more money in their pockets to spend, and these industries are labor-intensive, responding to increased consumer spending by creating more jobs.
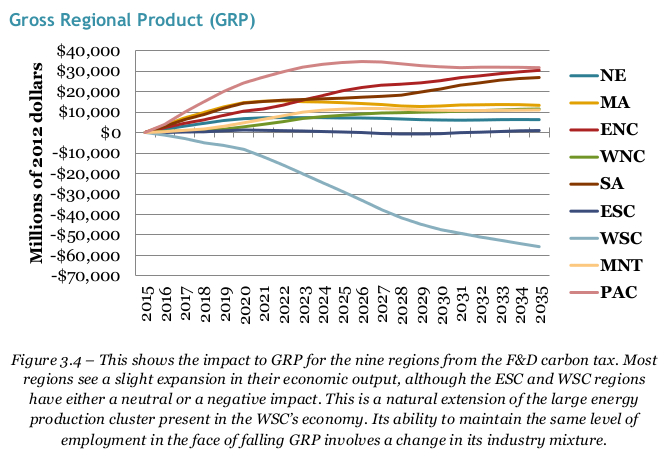
- Regional Gross Product is steady or rising in all 9 regions.
Interpreting the Results: Take-home points
The biggest take-home from this study is that there is no economic argument against Fee and Dividend. It creates jobs, grows the economy, saves lives, and makes Americans richer. It does this while also reducing CO2 emissions to 31% below 1990 levels by 2025, and to 50% below 1990 levels by 2035.
F&D therefore sets the new standard for climate and economic policy. Other policies must now compare their climate and economic impact against F&D. To be against doing anything is to be against jobs, against a larger economy, and against saving American lives. We know of no politician who wants to be against these things, and so we hope that this study will clear the way to rapid passage of F&D.
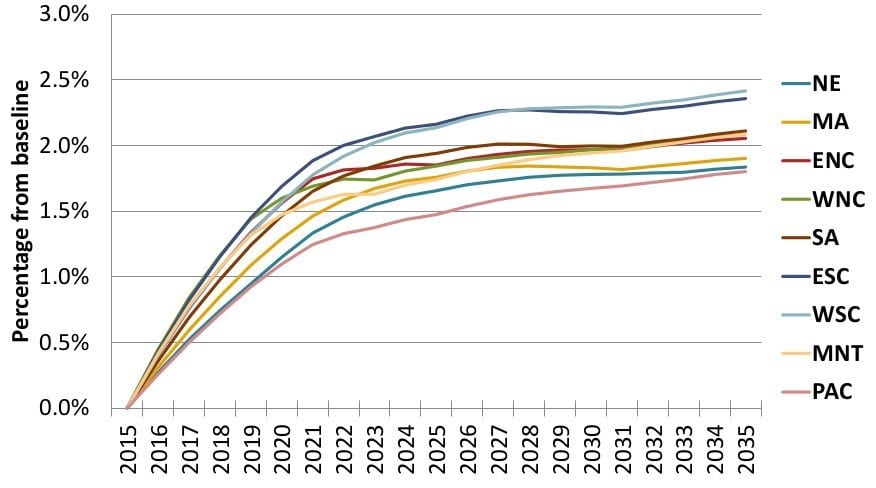
Figure 7: Cost of living increases by region. The lowest cost of living increase is around 1.7%, and the highest is 2.5% in 2035. The total increase over 20 years is thus about equal to 1 year of average inflation.
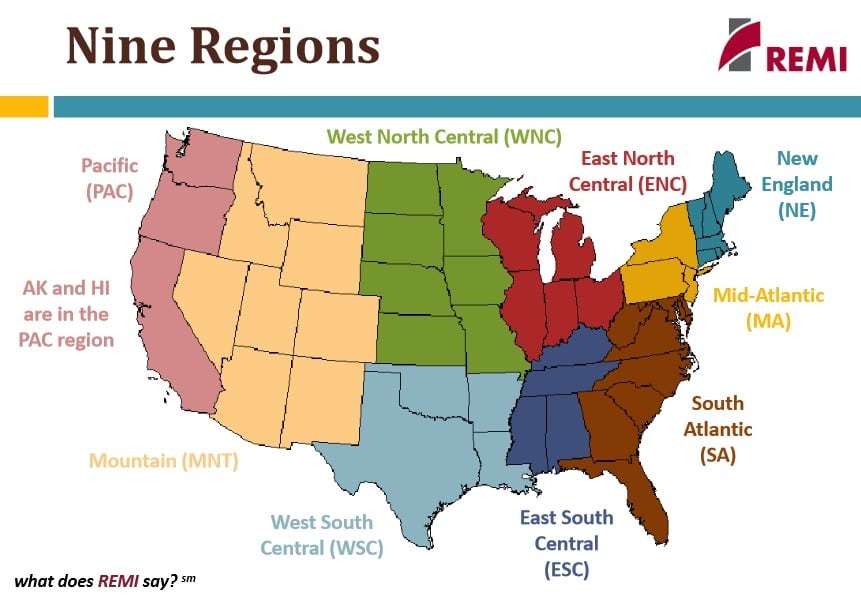
The REMI study includes analyses of 9 U.S. regions (see map below). Those regional summaries can be downloaded below:
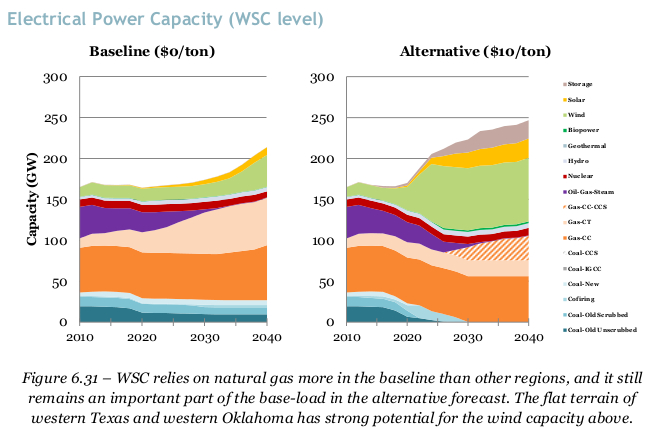
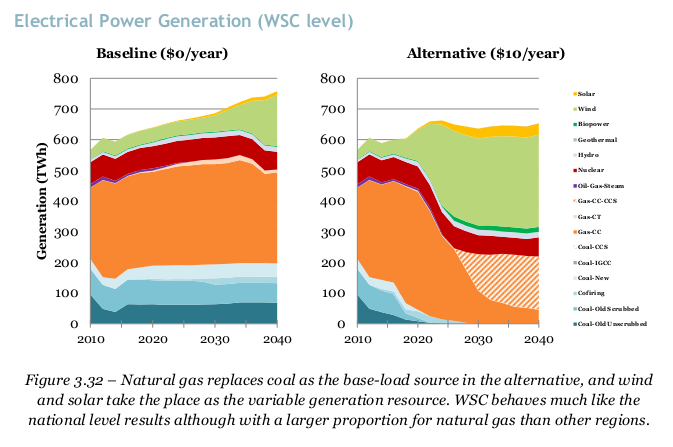
- West South Central (WSC) Regional-Summary – Arkansas, Louisiana, Oklahoma, Texas
- West North Central (WNC) Regional Summary – Iowa, Kansas, Minnesota, Missouri, Nebraska, North Dakota, South Dakota
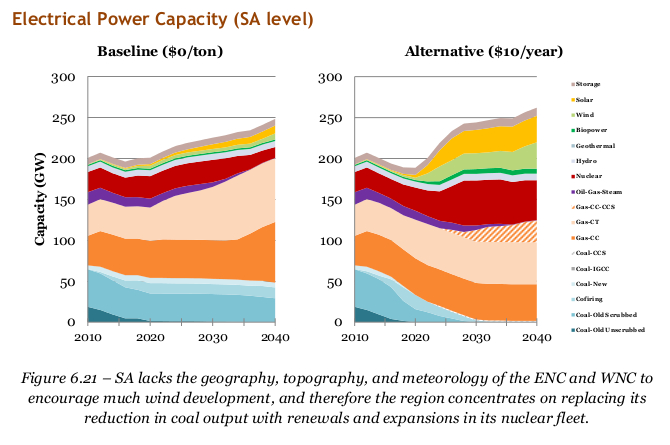
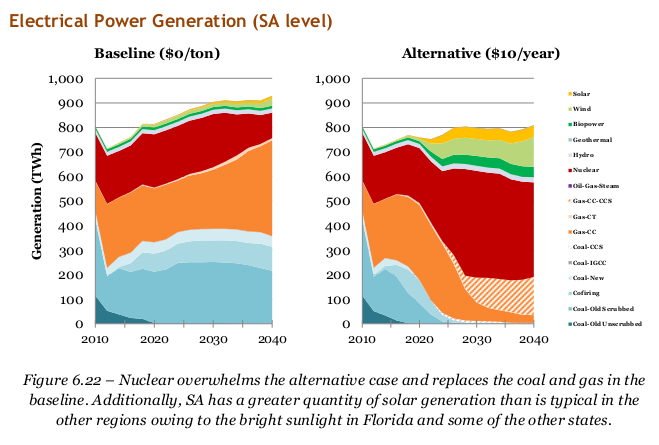
- South Atlantic (SA) Regional Summary – Delaware, Florida, Georgia, Maryland, North Carolina, South Carolina, Virginia, West Virginia
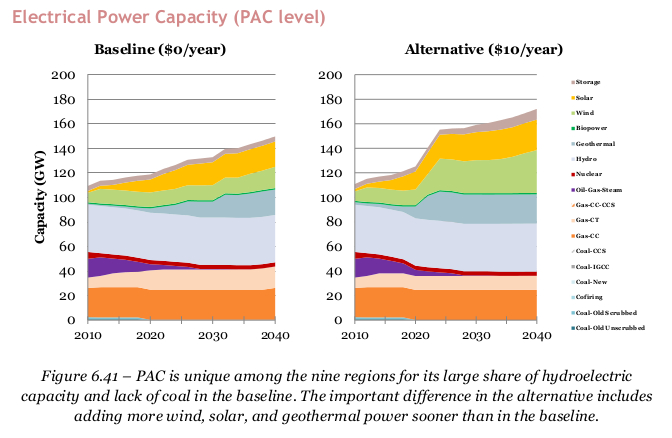
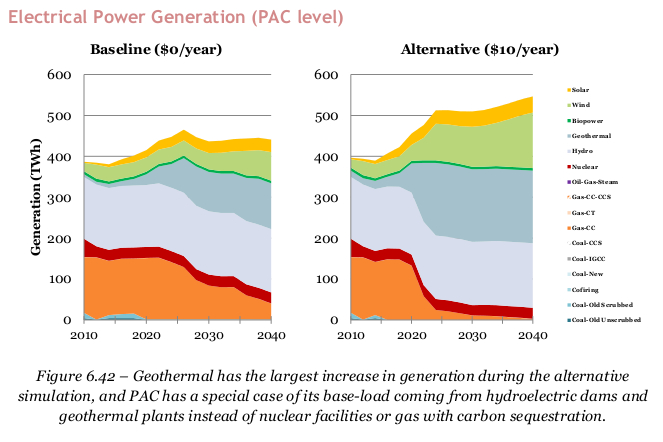
- Pacific (PAC) Regional Summary – Alaska, California, Hawaii, Oregon, Washington
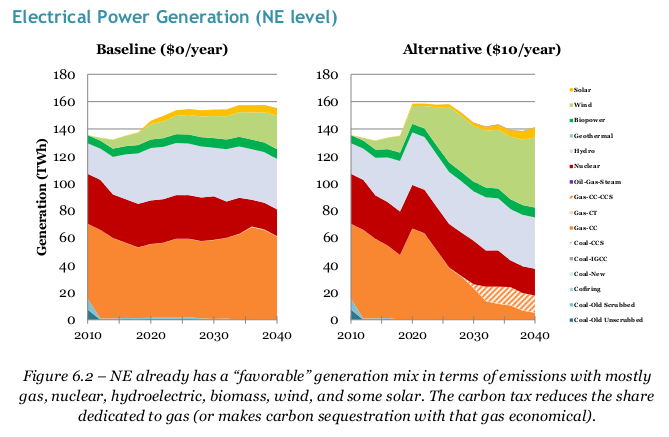
- New England (NE) Regional Summary – Connecticut, Maine, Massachusetts, New Hampshire, Rhode Island, Vermont
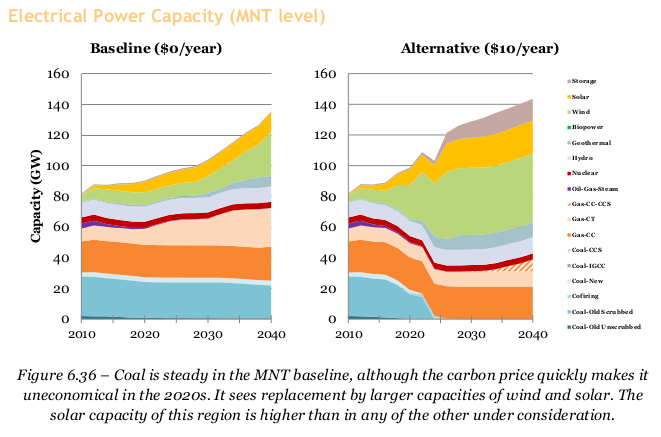
- Mountain (MNT) Regional Summary – Arizona, Colorado, Idaho, Montana, Nevada, New Mexico, Utah, Wyoming
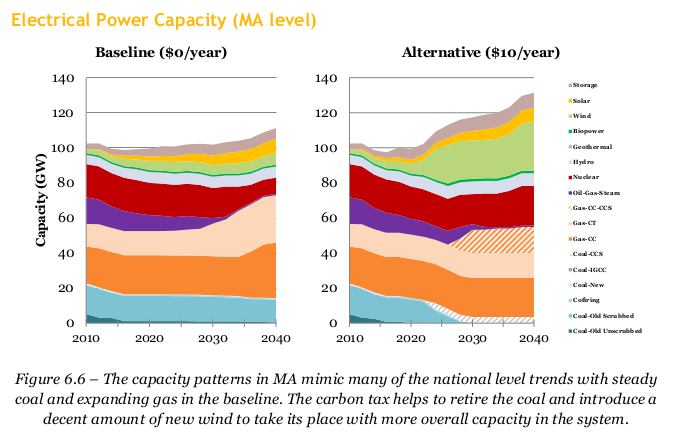
- Mid-Atlantic (MA) Regional Summary – New Jersey, New York, Pennsylvania
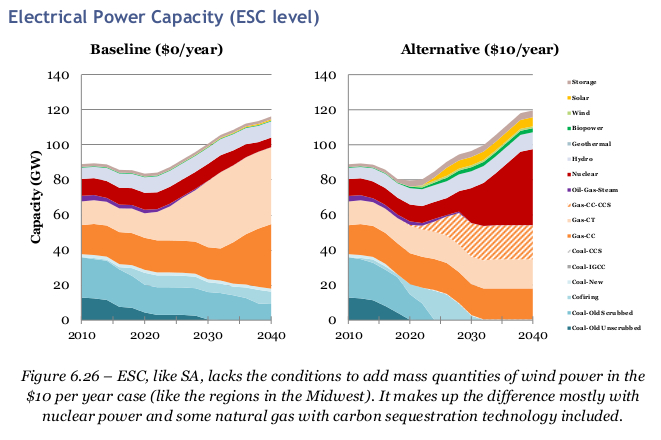
- East South Central (ESC) Regional Summary – Alabama, Kentucky, Mississippi, Tennessee
- East North Central (ENC) Regional Summary – Illinois, Indiana, Michigan, Ohio, Wisconsin
The Economic Case for a Fee & Dividend Carbon Tax — REMI (Pt. 1)
The Economic Case for a Fee & Dividend Carbon Tax — REMI (Pt. 2)
Videos by Erica Flock

About REMI
Since 1980, Regional Economic Models, Inc. (REMI) has provided economic impact studies for governmental and private-sector clients including the Atlanta Regional Commission (ARC), consulting firms Booz Allen Hamilton and Ernst & Young, the Korea Energy Economics Institute (KEEI), Sandia National Laboratory (SNL), the California Department of Finance, the University of Michigan and the Massachusetts Institute of Technology (MIT), and the Tennessee Valley Authority (TVA).
The REMI model incorporates four major modeling methodologies including input-output modeling, computable general equilibrium modeling, New Economic Geography, and econometrics. Its structure accounts for both the costs and benefits of any policy options, and it provides detailed, multi-regional, and multi-year results on the economic and demographic impact of decisions including the implications for job creation, gross domestic product (GDP), personal income, and population.
This study used data from the Energy Information Administration (EIA) and the ReEDS model, developed by the National Renewable Energy Laboratory (NREL) and run here by Synapse Energy Economics, to show the net effect of a national-level fee-and-dividend carbon tax when accounting for the downside of higher energy costs and reduced energy production versus the benefits of additional household income and spending, improved air quality, and investment in alternative power generation types.
Other major REMI studies in the energy arena include state-level carbon tax analyses for Massachusetts, Washington, and California. Other studies include the impact of Medicaid expansion in 25 states and the state-by-state impact of federal immigration reform options. General studies using REMI include economic development, energy, transportation, education, tourism, taxation, and other topics.
CCL hired REMI because we are committed to quality data free of ideological taint that you might get from some think tanks. As its name suggests, REMI models regional economics. It does this well. Dr. George Treyz founded REMI in 1980, after working as an academic with Nobel Prize-winner Lawrence Klein and other pioneers in the field of econometric modeling. REMI’s modeling products grew from Dr. Treyz’s work on one of the first regional macroeconomic models ever created: the Massachusetts Economic Policy Analysis (MEPA) model. Close links to the upper echelons of academia have persisted throughout REMI’s 3+ decades of experience, resulting in several academic publications in journals such as the American Economic Review, the Review of Economics and Statistics, and the Journal of Regional Science.
This experience and expertise is why private and public entities from all across the political spectrum have entrusted REMI to do their analyses, and paid them well for that expertise. These former clients include, but are not limited to: the American Gas Association (AGA), the Nuclear Energy Institute (NEI), the National Federation of Independent Business (NFIB), the National Education Association (NEA), the International Brotherhood of Teamsters, Booz Allen Hamilton, EY (formerly Ernst and Young), PWC (formerly Price Waterhouse Coopers), and ICF International. Like CCL and CCEC, REMI is truly nonpartisan.
In that same spirit, CCL and CCEC did not attempt to influence the outcome of the report in any way. In fact, we were excited when we saw that not all the results were positive for every region, because that speaks to the integrity of the analysis. Our first priority is a livable world, and we can’t get there without an honest and clear-eyed view of the facts.
There is no economic argument against Fee and Dividend. It creates jobs, grows the economy, saves lives, and makes Americans richer.
Individual graphs from the REMI study, not including images from the Executive Summary or Introduction . These images are excluded because they appear elsewhere within the report with a proper label and description.
To download, PC users can right click the picture and select “Save Image As”. Mac users should hold the control key, click the picture and select “Save Image As”. Both of these will direct you to a prompt where you can choose what to name the file and where to save it.