Citizens’ Climate Lobby has advocated for Carbon Fee and Dividend for nearly a decade. In 2019, members of the House introduced the bipartisan Energy Innovation and Carbon Dividend Act, which embodies the fee-and-dividend approach we support. We are now advocating for this specific bill.
Financial Impact of the Energy Innovation and Carbon Dividend Act on U.S. Households
In August 2020, Citizens’ Climate Education (CCE) and Citizens’ Climate Lobby (CCL) released a working paper that projects how U.S. households will fare financially under the Energy Innovation and Carbon Dividend Act. This document, entitled “The Impact of a Carbon Fee and Dividend Policy on the Finances of U.S. Households,” is a follow-up to a 2016 study that had preceded the drafting of legislation in 2018.
The bill imposes a fossil fuel carbon fee at $15/metric ton of CO2-equivalent, and then distributes all the net proceeds to eligible U.S. residents on a per-capita basis as monthly Carbon Dividends. Adults receive full shares and children receive half-shares. Because of enduring interest from members of Congress in how their constituents would fare under the policy, CCE and CCL commissioned independent researcher Kevin Ummel to conduct this analysis. Mr. Ummel, a Research Affiliate at the University of Pennsylvania and President of Greenspace Analytics, had previously authored the 2016 study.
The new study aligns with the legislative language of the Energy Innovation Act and uses the most recent available economic and emissions data. It also incorporates methodological improvements, such as using consumption as a benchmark for household economic status and adjusting the assumed pass-through of carbon fee costs to households, based on recent research.
Study Highlights:
- 61 percent of households and 68 percent of individuals in the U.S. end up receiving more than enough in monthly carbon dividends to offset their increased costs. Figure 1 shows how those net benefits break down across quintiles (each quintile = 1/5 of the U.S. population) ranked by household spending (consumption).
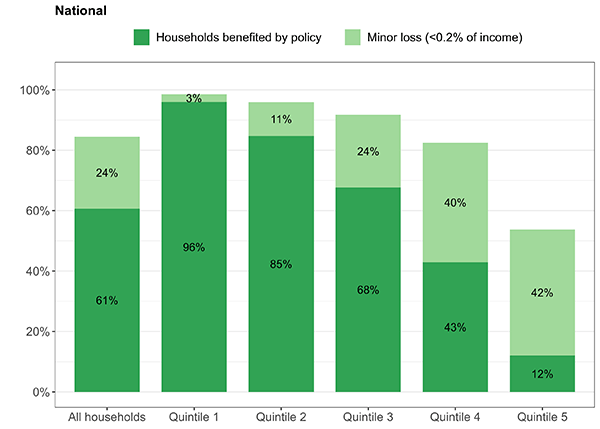
Figure 1. Percent of households whose carbon dividends exceed carbon costs, ranked by consumption quintile. The lighter green denotes a “minor loss,” defined as less than 0.2 percent of income (e.g., for a $50,000 income, less than $100 per year)
Taking statistical uncertainty into account, a ‘minor loss’ of less than 0.2 percent of income (light green bars on the charts) can be considered essentially within the ‘break even’ range. Thus, it’s safe to say that carbon dividend payments will essentially cover increased costs for 85 percent (61 + 24 percent) of U.S. households. Similarly, if you add the dark and light green bars for the first three quintiles – the least wealthy 60 percent – fully 95 percent of those families will statistically come out ahead or break even.
- The reason the policy favors poorer households is demonstrated in Figure 2.

Figure 2. Comparison of Year 1 household costs from carbon fee with Year 1 carbon dividends. Direct energy is gasoline, electricity, and home heating. Indirect energy is embodied energy in all other purchases. Financial asset costs accrue from carbon costs incurred by businesses and passed back to owners. Carbon dividends are net after personal income tax.
Wealthier households (Quintile 5) have much higher carbon footprints. Thus, the policy places the financial burden upon those who contribute the most emissions, inherently relieving the most economically vulnerable households from bearing the burden for decarbonizing the economy.
- Figure 2 also shows that carbon dividends will exceed costs for the bottom three quintiles, with the fourth quintile roughly breaking even. Note that these carbon costs are determined by behavior, regardless of income. In the aggregate, those with higher incomes typically consume much more, but nothing in the policy prevents a household from making consumer choices that will reduce their pollution-related costs, if they are motivated to do so.

The study also illustrates results for other demographic groupings.
- Figure 3 shows how the net benefits work out according to race/ethnicity. Families of color experience, on average, more financial gains under this plan as a result of lower household spending (associated with lower carbon footprint), larger families (lower emissions per capita), and/or other community factors (e.g., more use of public transportation).
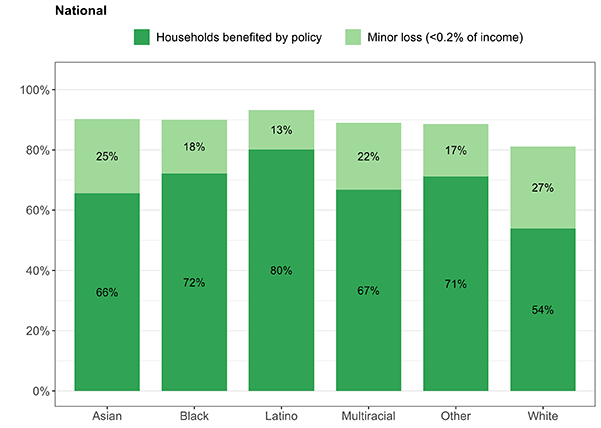
Figure 3. Percent of households whose carbon dividends exceed carbon costs, arranged by race/ethnicity.
- Figure 4 shows the results according to community type (rural vs. suburban vs. urban). Across the country, there are few differences in economic outcomes between rural and urban communities. In specific districts, the results will vary based on the community composition (e.g., a district that is predominantly urban or predominantly rural may show larger disparities due to limited data on households that fall into a different category).
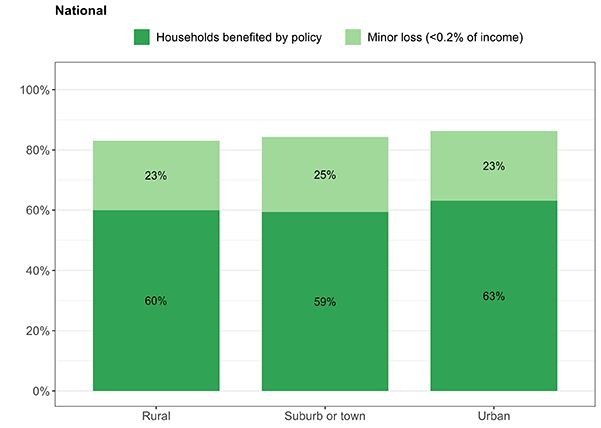
Figure 4. Percent of households whose carbon dividends exceed carbon costs, arranged by community type.
- Figure 5 shows the results according to age category. Older households tend to have smaller footprints, reflecting reduced mobility and consumption as a result of low fixed incomes. Younger households tend to be larger, and are therefore benefited by the dividend formula, in addition to typically having lower early-career spending. As with the other charts, these outcomes reflect mainly economic status.
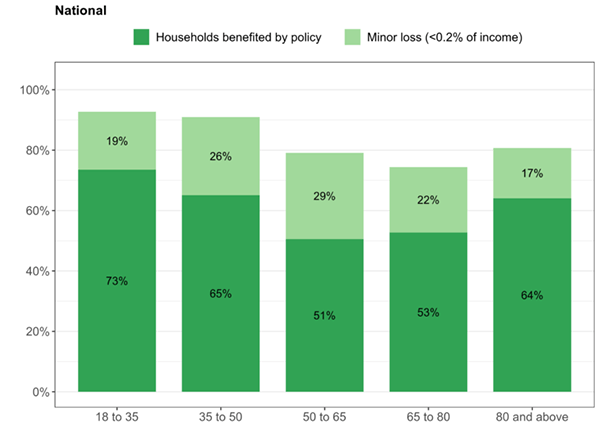
Figure 5. Percent of households whose carbon dividends exceed carbon costs, arranged by age category.
Improving Your Bottom Line
How can households reduce their carbon footprint, and thus either eliminate a net loss or increase their gain? There are many avenues for this, from more efficient transportation (e.g., public transit), more efficient living conditions (e.g., multi-family residence), and consumer choices that consider carbon footprint. This study did not allow for or anticipate any such changes in behavior, but they will become clear in the prices of competing goods and services. Of course, many carbon-reducing options (e.g., solar panels or electric cars) would be out of reach for families of modest means, which is why it’s important that their finances are protected even when they can’t afford such things.
Calculate the impact of Carbon Fee and Dividend on your budget.
About the study
The purpose of the working paper was to respond to enduring interest from members of Congress in how their own constituents would fare under the Energy Innovation and Carbon Dividend Act. To complete that study CCE and CCL commissioned Kevin Ummel, a Research Affiliate at the University of Pennsylvania, president of Greenspace Analytics, and author of a separate, earlier study estimating household financial outcomes under a carbon fee and dividend proposal prior to the introduction of Congressional legislation. Mr. Ummel had also completed a related study estimating household carbon emissions with zip-code level detail.
The analysis is limited to Year 1 and does not consider dynamic economic effects the policy would create over time. Pass-through of the pollution fee was considered under three scenarios: (1) 100 percent, which is a conventional assumption in most economic analyses; (2) 70 percent, based on a recent Georgetown University study revealing that pass-through varies by industry; and (3) 85 percent as a mid-range Baseline Scenario where the remaining 15 percent of carbon fee costs are passed back to capital owners. All scenarios assume the pass-through results in higher prices “overnight,” without changes in production or consumption in response to the price signal. Charts displayed here represent the results of the Baseline Scenario.
Conclusions
This study provides a useful look at how every congressional district does in unprecedented detail. Overall projections for how many households will receive more in dividends than the carbon costs they experience are approximately in line with previous estimates. This highlights the overall progressivity of the policy, in contrast to a regulations-only approach or a carbon tax that does not allocate revenue to households.
Study Resources
Household Impact Study FAQs
1. Some people insist that carbon taxes will hurt the poor, but this study says the opposite. Why?
Distributing the money to households equally per capita makes all the difference. It transforms what could have been a regressive policy into an inherently progressive one, protecting the poor and middle classes from undue economic burden while still preserving individual lifestyle choice. The reason is that overall energy use is far higher among wealthy Americans, largely because they travel more and spend a lot more on goods and services. For example, a household in the richest 20 percent accounts for about 2.6 times as much carbon pollution as one in the poorest 20 percent.
2. This is a working paper; what does that mean?
It is common practice in economics to submit working papers. Often, authors will release working papers to share ideas about a topic or to elicit feedback before submitting to a peer reviewed conference or academic journal. Working papers are often the basis for related works, and may in themselves be cited by peer-review papers. As such, the current publication may change over time. The most recent version reflects the best available data and understanding at the time of publication. CCL will ensure that the most current version of the working paper is the version available on our website.
3. Will the author try to get this published in a peer-reviewed journal?
Yes, it is the intention of the author to have this published in a peer-reviewed journal, and he is currently seeking comment on it from other economists. In the field of economics, it can frequently take years between when a paper is first submitted, and when it is finally published.
4. How is this study different from the 2016 Household Impact Study from the same author?
This study is closely aligned with the actual Energy Innovation and Carbon Dividend Act legislation, which didn’t yet exist in 2016. Principal differences, as explained in the paper, are these:
- In the 2016 version, only two children per household would have received dividends. In this version, as in the bill, there is no limit on the number of eligible children.
- The new study accounts for 2017 changes to federal tax laws.
- The new study examines multiple pass-through rates of 100, 70, and 85 percent.
- The new study uses new “consumption-based” data for U.S. households and organizes quintile outcome analyses accordingly, with consumption considered a more accurate metric for household economic status than federally reported income.
- The model has been updated to use the most recent available data, and taxable emissions are now aligned with those actually covered by the legislation.
5. How does this study look at greenhouse gases other than CO2?
Consistent with the legislative language in the Energy Innovation and Carbon Dividend Act, the emissions basis in this study includes non-CO2 gases (CH4 and N2O) that result from combustion, and also includes fluorinated gases (f-gases) that are subject to a fee tied to global warming potential. Although considering only CO2 is common practice in economic literature investigating carbon taxes, this new study was designed to reflect the actual legislative language as closely as possible.
6. Are climate benefits from emissions reductions included in this study?
No. This study does not account for any benefits that result from avoided climate impacts or local air pollution. This means there are even more benefits to this policy than are explored in this study. You can explore some of those additional benefits here and here. Keep in mind that such co-benefits would accrue over time as fossil energy diminishes, but this study only covers the first year of the policy.
7. Are there any differences in expected outcomes between the policy modeled here and the Energy Innovation and Carbon Dividend Act?
There are two differences that may be considered most significant:
- This study does not account for possible changes in the Consumer Price Index (CPI) that may be affected by the carbon fee, which would impact programs with automatic “stabilizers” like Social Security and SNAP, but may also affect financial markets. Due to the complexity and uncertainty of these impacts, they are not modeled here.
- This study only considers the impacts of a single carbon price, $15 per ton of CO2-equivalent, whereas the carbon and f-gas prices in the legislation increase over time and emissions decrease. However, this is perhaps better described as a limitation of the model than a difference, since it is designed to assess policy impacts for only the first year.
8. Why does the report refer to the carbon fee as a “carbon tax”?
In the academic literature as well as in legal parlance, “carbon tax” is the general term for various policies that increase the price of burning fossil fuels by a fixed amount based on the carbon content and other properties of the fuel burned. CCL and the bill sponsors prefer “fee” because that emphasizes the fact that the revenue is not spent by the government but returned to U.S. households. The difference is mostly semantic.
9. What is the difference between direct and indirect emissions?
Direct emissions are those associated with direct consumption of energy by households (e.g., electricity, natural gas, gasoline, etc.). Indirect emissions are those that occur during the production or delivery of other goods and services (e.g., food, electronics, a visit to the doctor, etc.) that consumers purchase.
10. Is the dividend taxable in this study?
Yes, and this is consistent with the legislation. Output from the Urban-Brookings Tax Policy Center Microsimulation Model was used to estimate the income tax burden on different households. The dividend in the study is assumed to be taxable income at the federal level (but not at the state level) for calculating an after-tax dividend amount. However, the dividend is not counted as taxable income to determine eligibility for means-tested federal programs. This study also accounts for tax law changes that took effect in 2017.
11. Can you explain the assumptions about pass-through of carbon fee costs from businesses to consumers?
Economic analyses of tax policy have traditionally assumed 100 percent pass-through, but there is a growing body of literature suggesting that many industries will not pass through the entirety of a carbon fee to consumers. A 2016 working paper from Georgetown University estimates a pass-through of 70 percent. However, the fate of the remaining 30 percent, which was not detailed, has an impact on household economics as well. For this study, the author considers three scenarios: a “minimally progressive” scenario with 100 percent pass-through (Scenario 1); a “maximally progressive” scenario with 70 percent pass-through and the remaining 30 percent passed back to owners/investors (Scenario 2); and a mid-range “baseline” scenario with 85 percent pass-through and 15 percent pass-back to owners/investors (Scenario 3). This treatment assumes that some portion of pass-back costs will accrue to owners/investors and some to worker wages, and thus assuming all of the 30 percent pass-back in Scenario 2 going to capital is not as realistic as the 15 percent assumed in Scenario 3, which is more realistic. This is also consistent with a 2007 study by the National Commission on Energy Policy that concluded pass-through of a carbon price would be 87 percent. Regardless of the pass-through rate, the same amount of carbon fee revenue would be raised and returned as dividends, but households would see energy costs rising by less. Thus, more households would be expected to benefit with a lower pass-through rate.
12. Does this study include a border adjustment?
Yes, but there are some differences between the border adjustment modeled and the border adjustment written into the Energy Innovation and Carbon Dividend Act. The legislation applies a border adjustment only to trade in “carbon-intensive trade-exposed” goods. The analysis here effectively assumes the border adjustment is applied to all goods. This model also assumes that imports consumed by U.S. households have the same carbon footprints as domestically produced counterparts, whereas in reality there will likely be differences. This is a conservative assumption because such treatment is least likely to fall afoul of WTO considerations regarding National Treatment, and because the U.S. power sector is relatively clean and carbon-efficient compared to that of most other countries. However, the effect of these discrepancies on distributional outcomes, the main focus of this study, are likely to be small.
13. What kind of a model is this?
This study consists of a micro-simulation of household-level effects using two nationwide surveys (American Community Survey and Consumer Expenditure Survey) and industry-specific “input-output” data from the Bureau of Economic Analysis as primary inputs. This new study (HIS2) differs from the 2016 study (HIS1) in the following respects: (a) the expansion of the pass-through assumption into three scenarios (explained above); (b) the use of consumption rather than income as a basis for dividing households into financial status quintiles; (c) calibration of the consumption datasets to correct for underreporting of household spending; (d) new carbon footprint data from the EPA; (e) expanding dividend eligibility to all children in a household; and (f) calibration of dividend taxation to comply with the Tax Cuts and Jobs Act of 2017.
14. What is the meaning of “consumption” and why is it used rather than “income” as an indicator of household financial status?
Consumption is defined as the purchase of goods and services for use by a household. Income is money received by the household. According to the author, consumption is generally better than income for measuring how “well-off” a household is, and it is used in a number of recent studies to describe distributional outcomes. Income based on IRS data can distort the financial well-being of households by including some who draw on untaxed resources like tax-free retirement accounts or reverse mortgages. This can result in a significant fraction of households categorized as “low-income” appearing to do poorly under this policy, when in reality those households have high consumption and high carbon footprints based on their spending of resources not counted as income. Therefore, this study presents quintile data in terms of consumption rather than income.
15. Why are there different numbers for the percent of households that benefit and the percent of individuals?
Children explain the difference. The child dividends and the high carbon efficiencies realized in households with multiple people living in the same home mean that households with children are disproportionately likely to end up ahead. So, you can have a lower percentage of households but a higher percentage of the population living in such households registering a net gain.
16. How would the results change if the carbon fee were higher?
If the initial price modeled were, say, $30 per metric ton of CO2e instead of $15, the dollar amounts for the net benefit or loss would change approximately in proportion to the size of the fee, but the proportions of households ending up ahead or behind would be roughly the same. Thus, we would also expect the percentage in the “minor loss” category to decrease. It’s important to remember that this study cannot model other changes, such as shrinking emissions, that will take place over time as the carbon fee increases.
17. Does this study account for changes in consumer behavior?
No. Importantly, this analysis is “static” and does not consider “dynamic” effects that a carbon tax would have on economic growth, employment, wages, trade, or consumption patterns over time. Nor does it consider local or global environmental benefits. Instead, the study calculates the short-term financial effect on families, assuming that the policy is implemented “overnight” with an assumed pass-through of the tax into consumer prices, no change in household behavior, and no change in production processes, technologies, or emissions.
18. What sources of information were used to do this work?
Several databases were used to compute the results in this study. A basic description of what they are and how they were used follows:
- Household-level expenditure by category is available from the Bureau of Labor Statistics (BLS) Consumer Expenditure Survey (CE). It uses consumer-reported data.
- “Input-output” tables and “national accounts” data from the Bureau of Economic Analysis (BEA) are used which detail monetary flows of commodities to and from industries. These tables are used to estimate carbon intensity of expenditure (CIE) for individual commodities.
- The American Community Survey Public Use Microdata Sample (PUMS) is much larger than the CE, but both have large overlap in household and geographic variables. This study takes the fused CE-PUMS dataset as its starting point. It contains inflation-adjusted expenditures (2018 dollars) for 1.3 million households across 57 different expenditure categories over the period 2015-2018, along with the complete set of household-level variables inherent to the PUMS.
- The USEEIO life cycle assessment model produced by the U.S. EPA provided emission factors to convert household-level consumption into greenhouse gas (GHG) footprints. It provides state-of-the-art results for nearly 400 commodities using emissions data from 2016.
- In the case of fuel imports and exports, the associated carbon is calculated separately by integrating additional EIA data on physical quantities of fossil fuel produced, imported, and exported in conjunction with CO2 emission factors from the EPA.
- A proprietary dataset of consumer prices provided by the Council for Community and Economic Research (C2ER) provides reported consumer prices for 57 individual goods and services (referred to here as “items”) over 2015-2018 and for nearly 400 urban areas. These data indicate, for example, the retail price of a gallon of regular gasoline or a 2-liter bottle of Coca Cola, etc.
- The National Health and Nutrition Examination Survey (NHANES) contains a dietary interview in which participants recall physical quantities of food eaten over a two-day period. It is used to estimate the Gucci effect.
- EIA’s Residential Energy Consumption Survey (RECS) was used to analyze how the effective price-per-kWh varies with the level of electricity expenditure in different parts of the country.
- Results for community types (rural, suburb/town, or urban) are derived by estimating the dominant type for each of the 30,000+ zip codes using the “locale codes” spatial dataset developed by the National Center for Education Statistics (NCES).
19. What is the difference between 'poverty' and 'low income'?
For the categories in this study, “poverty” includes households earning less than 100 percent of the federal poverty level (FPL), while “low-income” includes households earning less than 200 percent of the FPL. Note the difference between consumption, which is used for dividing the population into quintiles showing economic well-being, and income, which is rigorously used to classify households under “poverty” and “low-income” categories in spite of the shortcomings of this label as discussed earlier. In this study, 90 percent of households with incomes below the FPL experience a positive net benefit, and 87 percent of low-income households benefit.
20. Does this study account for state and local taxes?
The study does account for differences in state and local excise and sales tax, but not state income or property taxes, when calculating geographic price differences. First, the study subtracted various state and federal excise taxes from prices. Following spatial interpolation of tax-free prices, applicable sales and excise tax for each item were added back to arrive at the tax-inclusive retail price in each zip code.
21. Does this study agree with the Congressional Budget Office (CBO) assumption that if a dividend is taxable, the policy is revenue-neutral?
Yes, this new study finds that this is the case. According to p. 35 of the working paper, “Simulated taxation of the dividend produces an effective tax rate of 18.2%. This is close to the share of the carbon tax burden (net of export rebates) falling on government as estimated in HIS1; indicating an approximately revenue neutral outcome.”
In actual practice, depending on both the policy design and the details of implementation, a bill like the Energy Innovation Act could in fact be revenue-negative, revenue-neutral, or revenue-positive for the federal government. Different models will come to different answers for the same policy, but what matters from an advocacy standpoint is the model and the assumptions that the CBO uses. Please note that “government” in the paper refers to all levels of government when it comes to the costs imposed by carbon pricing, not just the federal government. Note as well that the study did not account for state income taxes (see prior FAQ entry). The CBO is concerned only with the Federal Government.
22. Are there geographical variations in how families do across the country?
The working paper does go into some detail on overall results and distributional differences across states and Congressional Districts. In general, areas that have the best household outcomes typically enjoy some combination of milder climate, cleaner electricity, and/or greater population density. For various reasons, these areas also enjoy higher average household incomes. The opposite tends to be true in areas with more carbon-intensive energy, harsher climates, and lower population density. However, the lower the assumed pass-through, the less these spatial differences show up. The study also shows (see Figure 14 in the report) that the geographic differences are more pronounced among the wealthier residents of a given area.
23. What explains the age distribution?
The pattern of benefits across groups makes sense given the impact of age on both carbon footprints and dividend received. The oldest (80 and above) households tend to have smaller footprints, reflecting reduced mobility and less consumption as a result of lower spending patterns. Younger households tend to be larger—and therefore benefited by the dividend formula—in addition to less income/consumption in early career. Households in the 50 to 80 age range tend to have the highest combination of financial resources and spending activity along with smaller households as adult children have moved on to establish their own households.
24. Is consumption the only factor determining who benefits?
Household consumption is not the sole factor driving results, although it is a very important one simply because it correlates most closely with carbon footprint. Another important factor is household size, as more people sharing living space results in lower per-person emissions. Of course, there are many other lifestyle factors, such as size and type of vehicles, size and type of housing, carbon intensity of electricity from the local utility, and personal energy habits.
25. Does “household” in this study mean a tax-filing unit or people living under the same roof?
In this study, household refers to the individual consumer unit, in order to account for situations where unrelated roommates are economically independent. For example, a family or couple who shares expenses is a single consumer unit, but roommates who pay their own expenses separately are separate consumer units. This circumstance is uncommon enough that it doesn’t change the statistical outcomes of the study, but it is an important distinction to get accurate results in the online Personal Carbon Dividend Calculator.
26. What is the meaning of a “minor loss?”
A “minor loss” is defined as a net financial shortfall that does not exceed 0.2 percent of pre-tax household income. Since the median annual household consumption in the U.S. is close to $60,000, then 0.2 percent of that is $120 in a year. Besides the 61 percent of nationwide households that register a net gain, an additional 24 percent incur a “minor loss,” but this mainly affects households in the higher income range.
27. Why are there similar economic outcomes for rural, suburban/town, and urban households?
Some find it surprising that rural, suburban/ town, or urban location, which is determined at the zip-code level by determining how the majority of a zip-code area is categorized, has little impact on what percentage of households receive a net gain. Even though rural residents drive longer distances, have few public transportation options, and usually live in standalone housing, those factors are offset by the lower general cost of living vis-à-vis the carbon dividends they receive. Everyone gets the same dividend, so every dollar goes farther when the prices of gasoline, food, and other goods are lower. As for apartments, even though they are more energy-efficient than standalone houses, city rental rates can be astronomical! Again, it’s not only energy use, but the cost of all goods and services, weighed against the dividend, that determines whether a family comes out ahead or not.
28. What is in each of the different expenditure categories of Figure 2?
Direct Energy refers to energy used by households directly, such as gasoline, electricity, and heating fuel. Indirect Energy refers to the energy embodied in the materials, production, and delivery of all other goods and services that households purchase. Financial Asset costs are not an expenditure category, but represent the carbon fee expenses borne by businesses and ultimately passed back to investors. It accounts for the 15 percent of carbon fee costs that are not passed down to consumers.
These broad categories were broken down into more detail in the 2016 paper (Figure 16), and updated charts for the 2020 study are available on request.
For reference, Direct Energy consists of gasoline and utilities. Indirect Energy comprises food and drink, apparel, entertainment, household operation, other transport, other, and health care.
Keep in mind that Figure 2 does not represent all costs borne by households for these goods and services, but just the portion of costs incurred because of the carbon fee.
29. Why should we believe that 61 percent of households come out ahead?
The fact is that 61 percent of Americans have lower-than-average carbon footprints, which in turn means that some of the wealthiest Americans have exceedingly large ones. In fact, this study may still be conservative because it doesn’t take inflation-adjusted federal programs into account. By returning all net revenue equally to Americans on an individual basis, those who use less fossil energy are rewarded and encouraged to do even better. It happens that less wealthy households are far less responsible for climate-warming emissions than those who are more wealthy, simply because of their lifestyles and spending, even without taking special measures that they may not be able to afford.
30. Which members of the bottom 20 percent do not experience a positive net financial benefit?
Clarifying this question was one reason to switch from income to consumption as the key metric for expressing financial well-being. This change eliminated some well-to-do households who nonetheless showed up as “low income” in statistical data from the lower quintiles. There are, however, still four percent of Quintile 1 households that don’t break even. Some in this category may be individuals who are not struggling economically, such as a college student supported by his/her parents yet whose own income through a part-time job lands him/her in the bottom quintile. In any case, CCL is pleased to see that a statistical improvement compared to the 2016 study has revealed that, among those of meager means, almost none fail to gain under the policy.
31. Who is the author and why should we believe him?
Kevin Ummel is currently (as of August 2020) a Research Affiliate at the University of Pennsylvania as well as president of Greenspace Analytics. Previously, he was a Research Scholar in the energy program at the International Institute for Applied Systems Analysis (IIASA). He has a master’s degree in Environmental Sciences, Policy, and Management from the University of Manchester and a bachelor’s degree in public policy from Stanford University.
In 2014, Mr. Ummel published a working paper entitled “Who Pollutes? A Household-Level Database of America’s Greenhouse Gas Footprint,” while working as a Visiting Senior Associate at the Center for Global Development (CGD). This paper was the first to create a new database which matched the American Community Survey (ACS), a large-scale, nationally representative survey of households, with highly-detailed carbon footprint information.
In 2016, Mr. Ummel constructed the first Household Impact Study (HIS1), under CCL contract, to examine the impact of a carbon tax. This analysis was valuable in supporting CCL’s effort to move beyond a legislative proposal to helping initiate the first national bipartisan carbon pricing bill in a decade, in fall of 2018.
